After you define an area of interest (AOI), a panel appears on the left side of your Planet Explorer page. Here you can search for data using filters, date ranges, and imagery types.
You will see a few places in the application where you can view data:
- Preview scenes in the archive, where you can view and/or order.
- Basemaps your organization has access to.
- Hosted data that you have ordered.
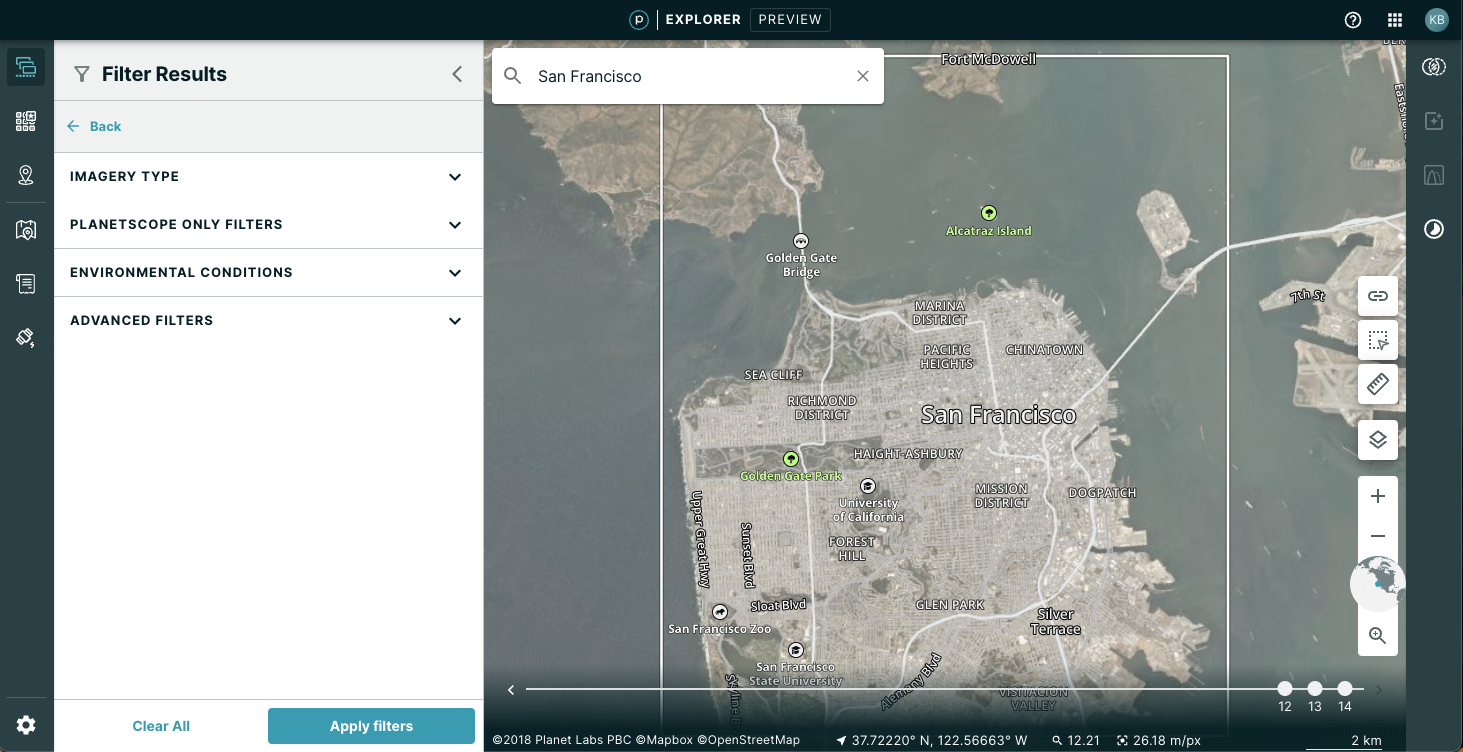
Filters Options
You can change your Filter settings to narrow your image results or make updates.
Filters are grouped according to imagery capabilities, PlanetScope filters, environmental conditions, and other attributes. The groups are collapsible for easy navigation.
After you select your filters, click Apply Filters. To start and begin with new filters, elect Clear Filters.
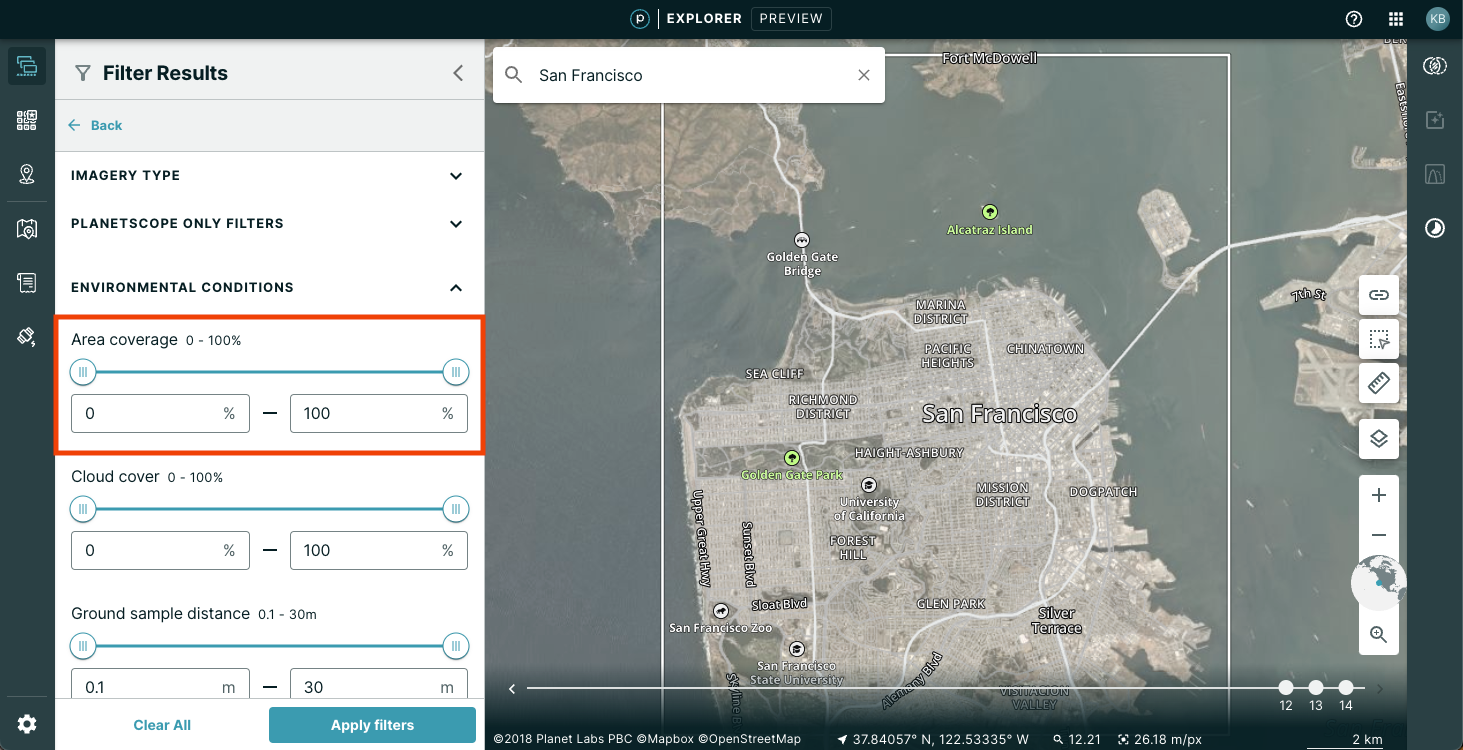
NOTE
To use filters with environmental conditions, enter the exact values or use the slider.
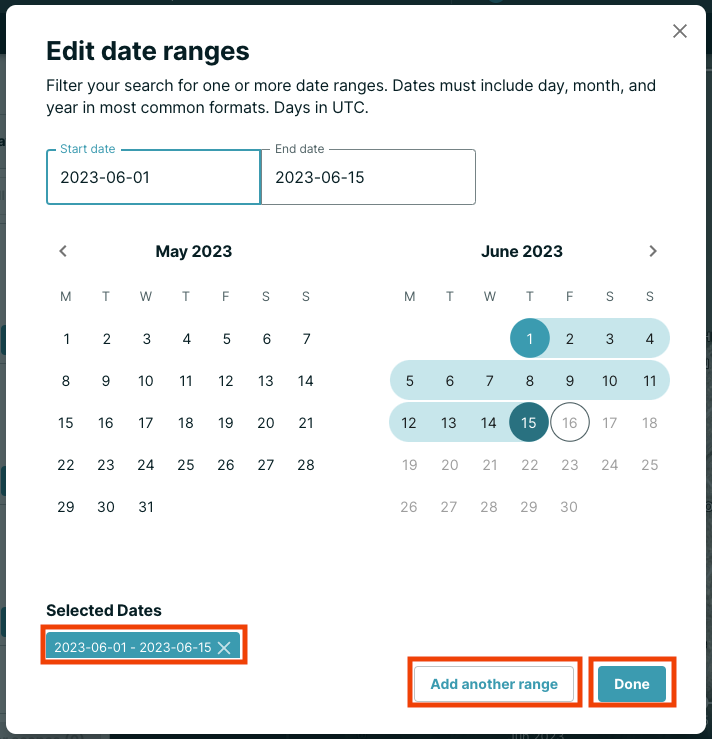
Date Ranges
You can select the date range for your imagery search results. Select the Dates icon and select the date ranges to filter your search for one or more date ranges. The days are UTC by default.
To easily compare results that are months apart, select multiple date ranges. You can enter one range, then click Add another range to enter a second range. You can add as many ranges as you need. Click Done to display the imagery within each range.
When you click Dates, an interactive Edit Date Ranges window appears. You have the option to remove the current date range or add additional dates of interest. You may remove any selected date ranges by clicking the X next to the date range that you wish to remove.
To make changes, click Done in the bottom right corner.
Scene Search Results
After you select your filters, the list of search results display imagery based on your parameters.
- Each search result represents a group of available imagery.
- Each search result appears as a thumbnail image and includes the date of the image, the percentage of area coverage for your area of interest, and the pixel resolution.
- If the image is partially over-rectified, an icon notification appears. Partially rectified imagery is considered test quality.
In each of these scene search result drawers, you will see actions that you can take.
When you preview scenes in the archive, you can filter your selections. Once you do that, you will see results organized by dates. Each of these result cards show three action buttons:
- The shopping cart quickly adds all images from a specific date to an order.
- The eye pulls up a preview of all images from a specific date on the map.
- X items > navigates to the scene level on a specific date to allow for more granular selections.
![]()
Once you click on the X items > button, you will see a list of satellite strips taken on that date and evaluate whether there are any overlaps to avoid. You can click into each strip to see individual scenes and make selections from there. At the strip level, you will see three action buttons:
- The shopping cart quickly adds all images from that strip to an order.
- The eye pulls up a preview of all images from that strip on the map.
- The double square locks the footprint of the entire strip on the map.
If you click into the strip, you will see a list of scenes in that strip. The scene level card shows two action buttons:
- The double square locks the footprint of the scene on the map.
- The eye shows how many scenes have been selected for preview in the strip.
![]()
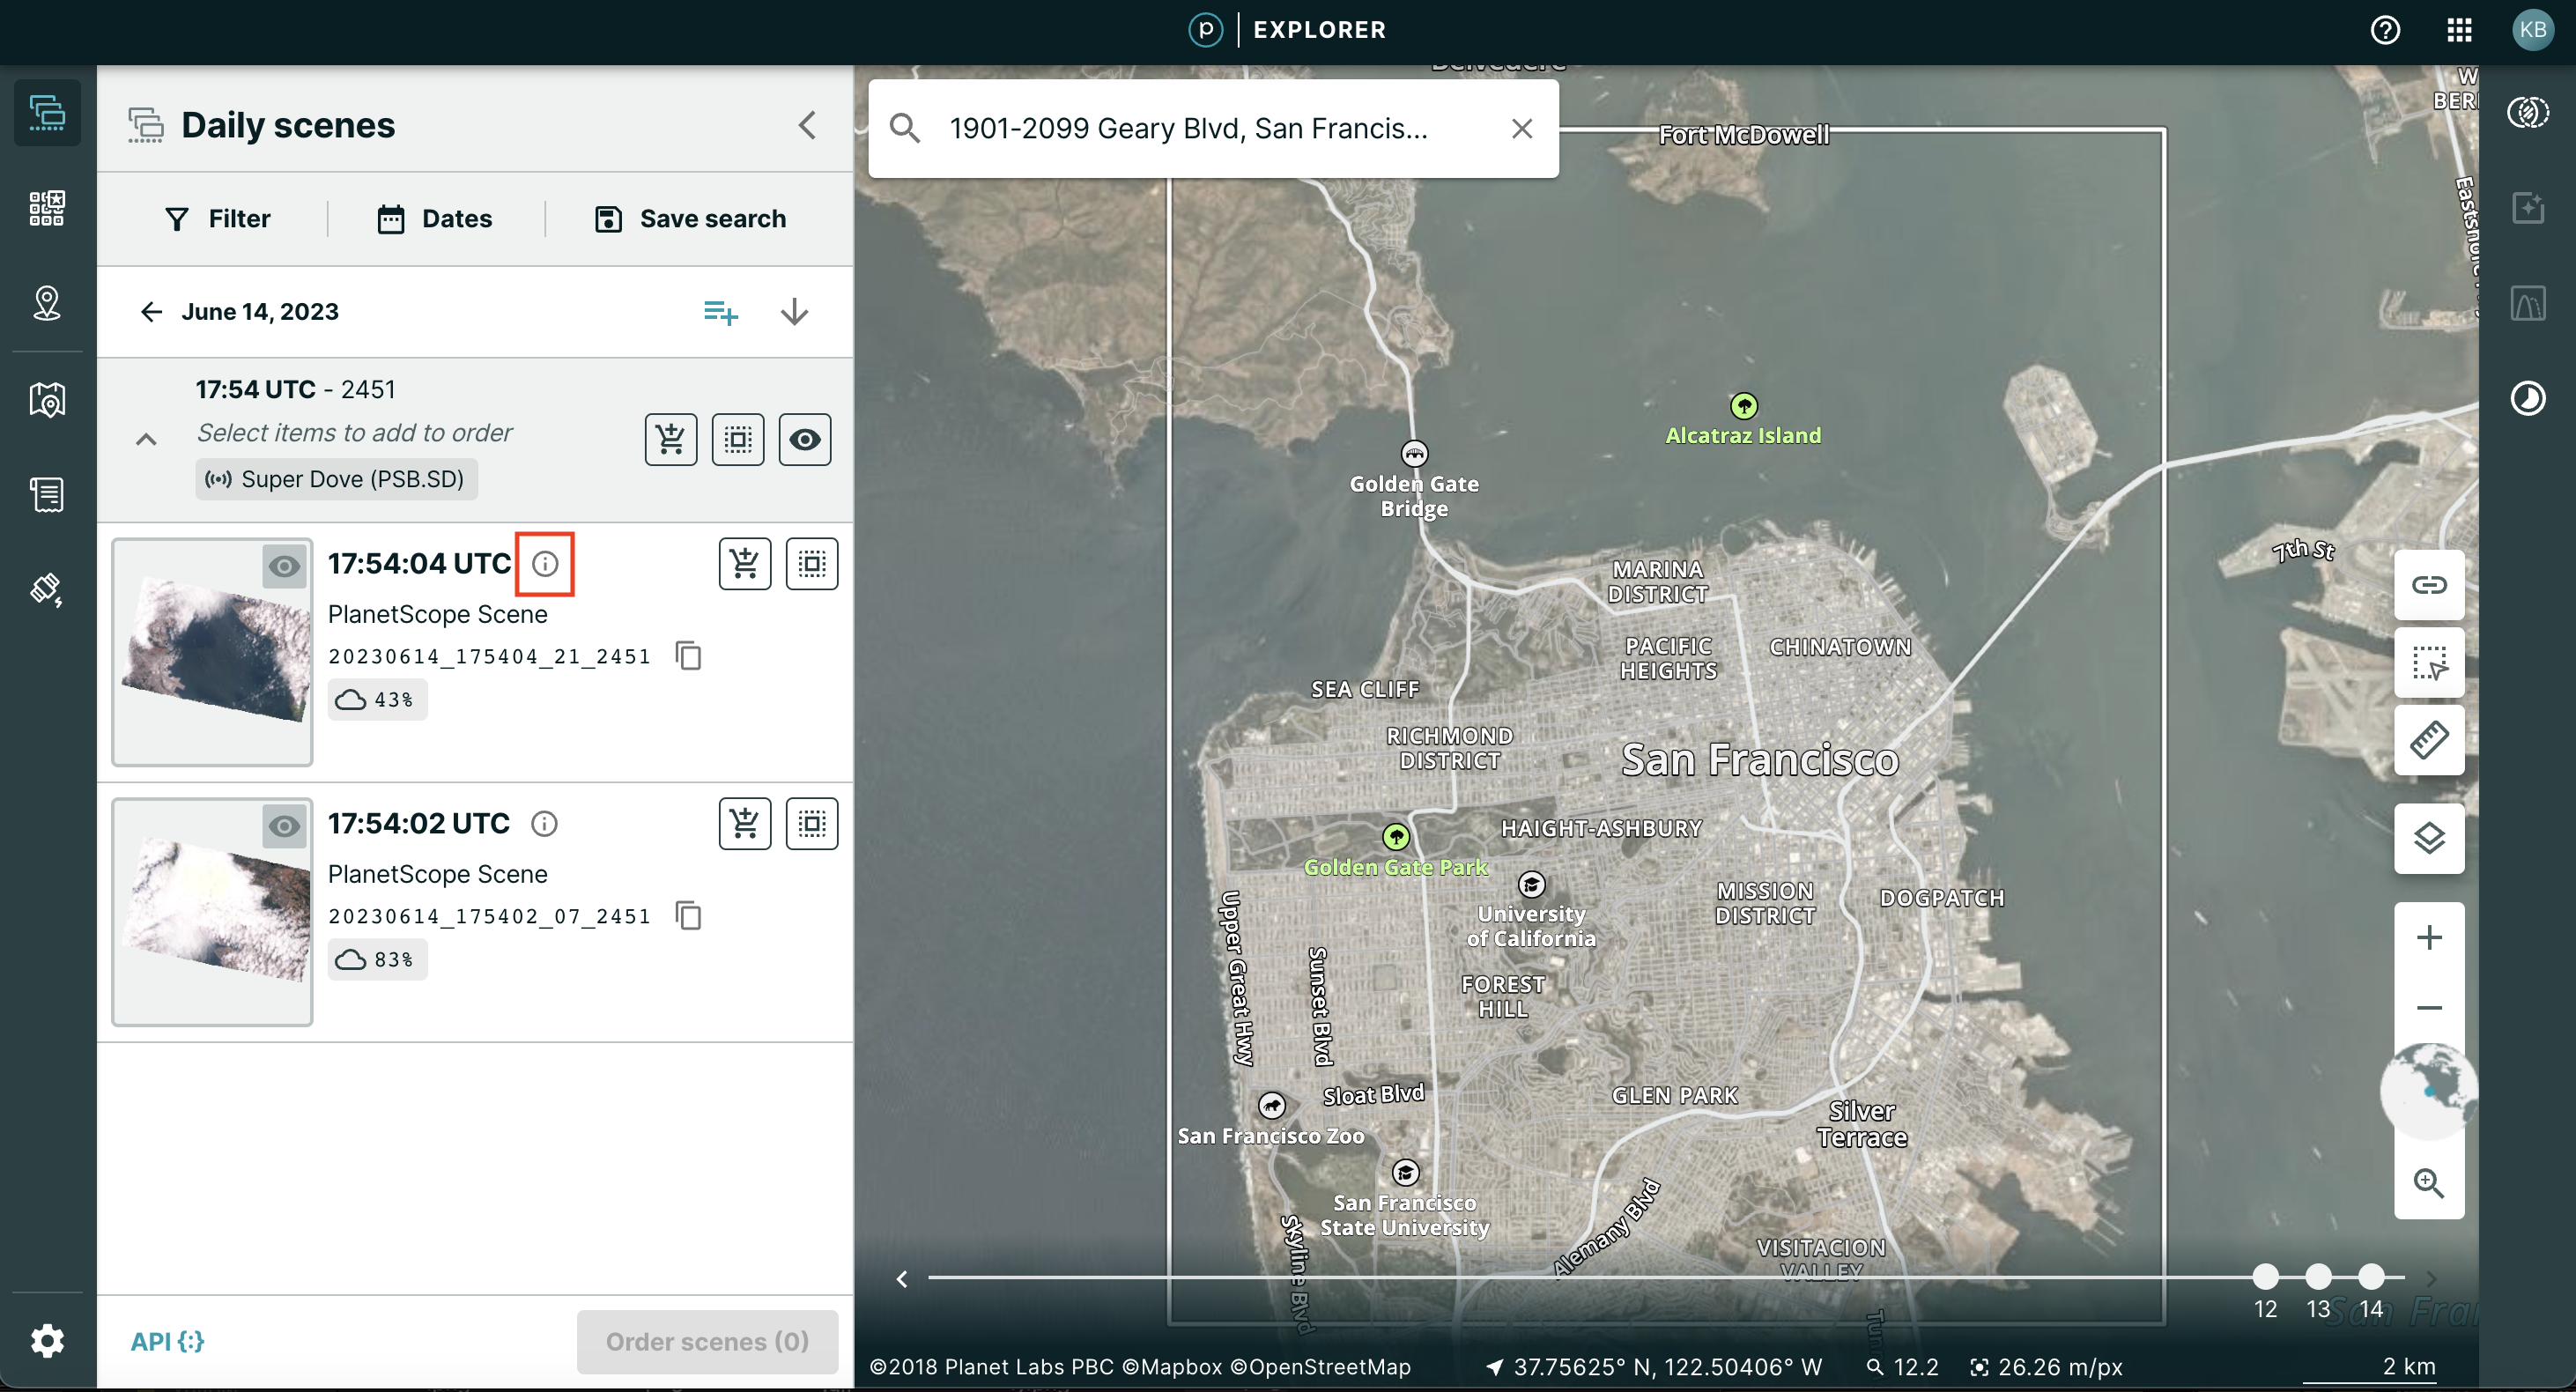
If you click the arrow from the search result, the tooltip displays View Details. This expands the grouping and displays all images taken on that date and grouped by satellite. You will see an icon with the instrument filter as shorthand for each satellite constellation. You can inspect imagery more granularly at this step by selecting and deselecting entire groups of imagery or single images.
You can click the view details symbol to the right of the date to see metadata about that specific image.
Overlay Layers Toggle
The toolstack tools located on the bottom right hand corner of the screen include an overlay toggle button. Use this button to adjust what you see on the map.
If you click the Street Labels toggle, you can turn the text labels on and off on the map. If the indicator is teal, the toggle is on.
If you click the Satellite View toggle, you can turn the contextual satellite layer on and off on the map.
NOTE
The contextual layer does not affect the number of tiles streamed.
Zoom Tools
The Zoom tools stack at the bottom right hand of the page enable you to navigate throughout your map view.
The + and - allow you to zoom out. If you hover over these arrows, the current zoom level displays. The current zoom level and how it translates into meters and pixels appears at the bottom of the screen.
The globe pictograph gives you context about where you are looking. The teal dot represents your current focus.
Additional zoom tools allow you to quickly zoom into an area of interest or out to the whole world. From left to right, the tools are:
- Zoom to area of interest is also called the rubberband zoom. This option allows you to draw a rectangle to zoom into an area. The rectangle is not permanent and is an indicator of what extent to zoom into.
- Zoom out to World enables you to zoom back to the largest zoom level.
Viewing Basemaps
To access your Basemaps, click the Access your Basemaps icon from the toolbar on the left side of your screen.
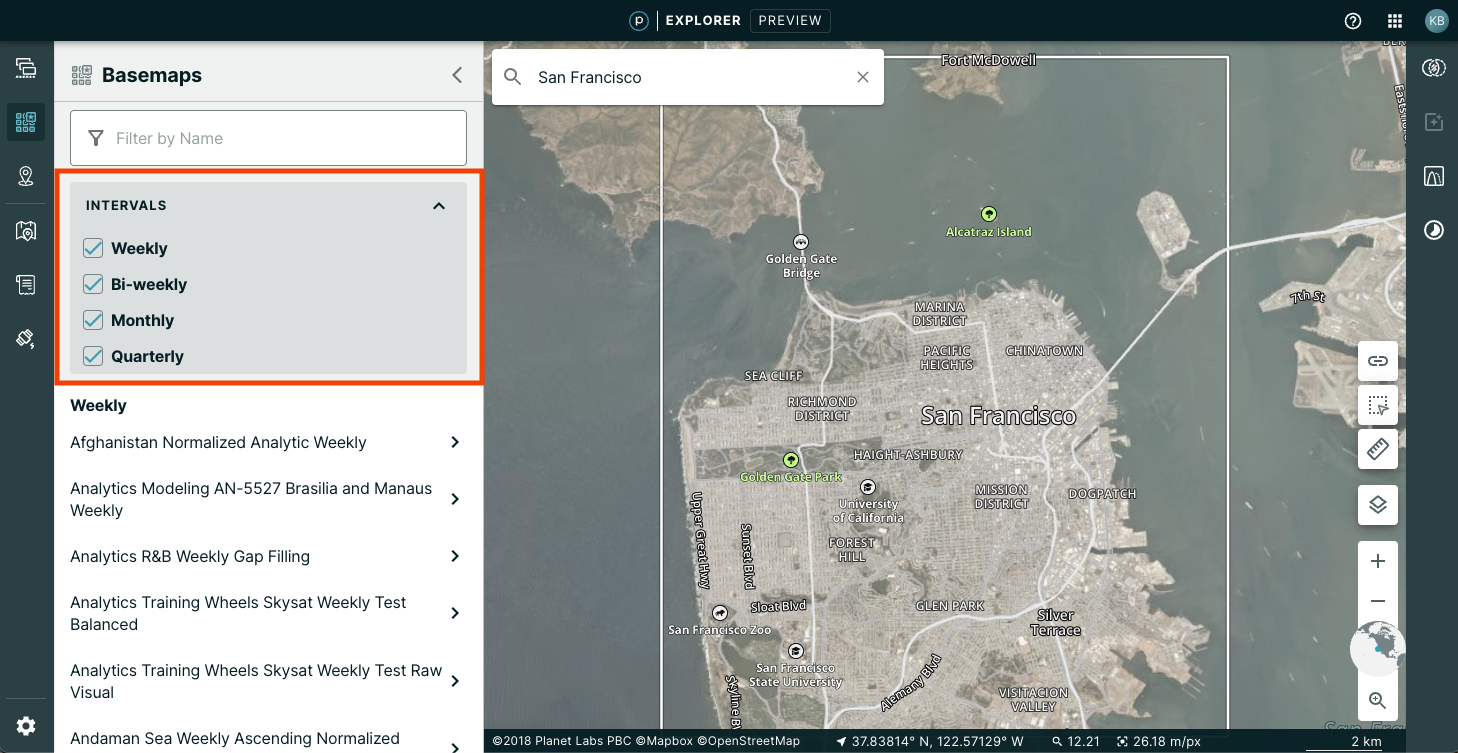
The Intervals option allows you to select the following options:
- Weekly Basemap changes the time slider to show each week of the year.
- Bi-weekly Basemap changes the time slider to show bi-weekly segments of the year.
- Monthly Basemap changes the time slider show each month of the year.
- Quarterly Basemap changes the time slider to show three-month increments of each year.
You can deselect a Basemap either by entering Command+Click for Mac or Control+Click for PC or by clicking on the Basemap name.
If you go into the drawer to see your basemaps, you will see a list of basemap series you have access to. You can click into each series to see the mosaics.
The basemaps card shows two action buttons:
- The compass allows a user to zoom directly to the basemap.
- The eye shows a preview of the basemap on the map.
![]()
Note: If you do not have access to imagery, an option to purchase access is available.
Rate this guide: