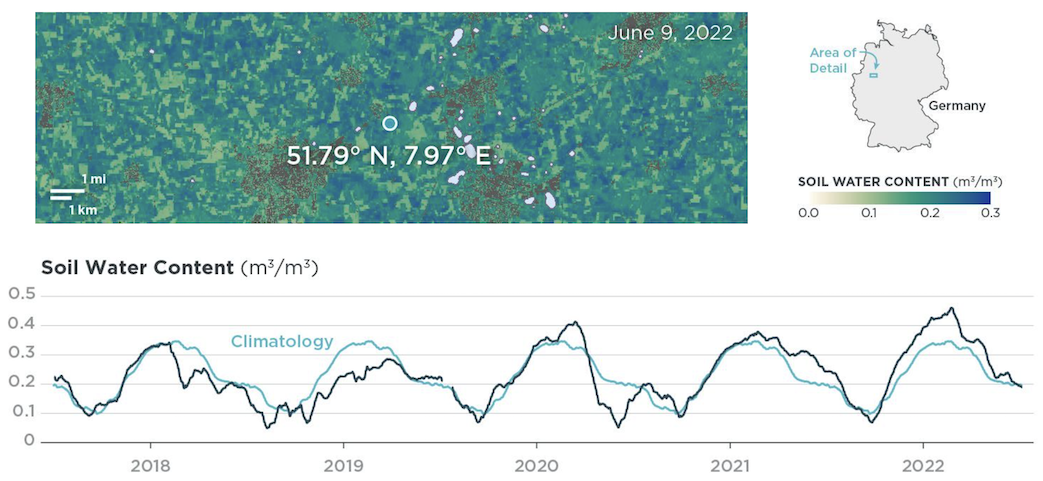
Soil Water Content Workflows

last updated: March 18, 2024

By leveraging Planet’s Subscriptions API to monitor and analyze the Soil Water Content Planetary Variable, you can identify and respond to changes more effectively. In this article, learn about the unique benefits of using the Subscriptions APIs to monitor and deliver Soil Water Content data at a high temporal resolution. Then walk through a typical workflow and discover additional resources.

Soil Water Content in Subscriptions API

The dynamic nature of surface soil moisture presents several challenges for water analysis and management, including maintaining optimal water management schedules, preventing water stress, and mitigating flooding risks.

Soil moisture is a critical variable in water-related systems, as it directly influences crop growth, nutrient availability, and the efficiency of water management practices. Soil water content can change rapidly due to various factors, such as precipitation, evapotranspiration, irrigation, and drainage. Consequently, maintaining optimal soil moisture levels requires frequent monitoring and adaptation to these changing conditions. The Soil Water Content Planetary Variable delivered through the Subscriptions API provides up-to-date soil water content data, enabling the monitoring of these temporal dynamics and making well-informed decisions based on the latest information.

View the latest Planet Soil Water Content Technical Specification.

Workflow: finding drought minimum values from soil water content data

Using Planetary Forensics To Visualize Historic Drought In The Horn Of Africa discusses a use of the Soil Water Content Planetary Variable that visualizes the historic drought in the Horn of Africa.

To assess the severity of the drought, “planetary forensics” techniques are employed, such as measuring the moisture content in the soil. The Soil Water Content data provided by Planet offers near-real-time measurements of soil moisture. This data is more accurate than traditional models based solely on precipitation totals because it accounts for water loss due to evaporation and surface runoff. By using satellite data, the soil water content measurements create visualizations that depict water levels and fluctuations over time, providing a granular understanding of the effects of dryness.

While the data in the article uses climatology methods to look back at the data, in this notebook walk-through example, you create a subscription, pull the results as CSV data, and then simply plot the mean, pointing out an increasing number of days with an anomaly of soil water content three standard deviations below the mean.

Setting up your script and connecting with Planet services

To execute the code in this example, you need access to the SWC-AMSR2-C_V4.0_1000 product for the Horn of Africa, but you can replace the geometries with your Area of Interest (AOI) and Area of Access (AOA).

Here, you import the necessary libraries and pull in the Planet API key stored in an environment file.

from io import StringIO
import datetime as datetime

from dotenv import dotenv_values
import requests
from requests.auth import HTTPBasicAuth
import json

from shapely.geometry import shape
import pandas as pd
import matplotlib.pyplot as plt

# Get your Planet API Key from an environment variable
DOT_ENV_VALS = dotenv_values(".env")

# Your Planet API Key 
API_KEY = DOT_ENV_VALS["PL_API_KEY"] 

# Planet's Subscriptions API base URL for making restFUL requests
BASE_URL = "https://api.planet.com/subscriptions/v1"

Next, confirm your API key by making a call to Planet services and receive back <Response [200]>.

# Confirm that the API key is valid
auth = HTTPBasicAuth(API_KEY, '')
response = requests.get(BASE_URL, auth=auth)
response

Creating a Planetary Variables Subscription with the Subscriptions API

To create a subscription, provide a JSON request object that includes required information, such as source type, your GeoJSON, and others. For details on required parameters, see Create a Planetary Variables Subscription in Subscribing to Planetary Variables.

Create your JSON subscription description object

Is your AOI inside the AOA for your contract with Planet? You can compare the two GeoJSON objects using Shapely.

# Area of Interest (AOI) - Horn of Africa
AOI = {
    "type": "Polygon",
    "coordinates": [[[44.157151999999996,10.349628999999993],
                        [50.31451299999999,11.464898000000005],
                        [51.231779,11.292913999999996],
                        [51.070788,9.921835000000002],
                        [49.491182,6.848406999999995],
                        [46.942479999999996,3.4837990000000048],
                        [44.151147,1.2562700000000007],
                        [44.157151999999996,10.349628999999993]]]
      }

# Area of Access (AOA) - Africa
AOA = {
    "type": "Polygon",
    "coordinates": [[[ 4.9531, 39.4232 ],
                        [ 33.8922, 32.9224 ],
                        [ 43.1191, 11.1132 ],
                        [ 58.0081, 12.1618 ],
                        [ 52.9752, -24.1169 ],
                        [ 39.9736, -33.7633 ],
                        [ 13.9703, -37.3283 ],
                        [ 7.4695, -6.0824 ],
                        [ -5.7418, 1.0475 ],
                        [ -17.0658, 7.5483 ],
                        [ -21.0501, 19.7111 ],
                        [ -13.2911, 33.3418 ],
                        [ 4.9531, 39.4232 ]]]
      }

# Determine if the AOI is inside the AOA
def is_inside(AOI, AOA):
    smaller_shape = shape(AOI)
    larger_shape = shape(AOA)

    return smaller_shape.within(larger_shape)

print(is_inside(AOI, AOA))  # True

Now you can describe your subscription in JSON format using the source of type soil_water_content.

# Create a new subscription JSON object
subscription_desc = {
   "name": "Horn of Africa 5 yrs SWC-AMSR2-C_V4.0_1000",
   "source": {
       "type": "soil_water_content",
       "parameters": {
           "id": "SWC-AMSR2-C_V4.0_1000",
           "start_time": "2018-05-15T00:00:00Z",
           "end_time": "2023-05-15T00:00:00Z",
           "geometry": {
               "coordinates": [[[44.157151999999996,10.349628999999993],
                        [50.31451299999999,11.464898000000005],
                        [51.231779,11.292913999999996],
                        [51.070788,9.921835000000002],
                        [49.491182,6.848406999999995],
                        [46.942479999999996,3.4837990000000048],
                        [44.151147,1.2562700000000007],
                        [44.157151999999996,10.349628999999993]]],
               "type": "Polygon"
           }
       }
   }
}

Create a subscription using your JSON description object

This is where you make the request to Planet and receive your subscription ID.

# Set content type to json
headers = {'content-type': 'application/json'}

# Create a subscription
def subscribe_pv(subscription_desc, auth, headers):
    response = requests.post(BASE_URL, data=json.dumps(subscription_desc), auth=auth, headers=headers)
    print(response)
    subscription_id = response.json()['id']
    print(subscription_id)
    subscription_url = BASE_URL + '/' + subscription_id
    return subscription_url

pv_subscription = subscribe_pv(subscription_desc, auth, headers)

Using the data from Planet

When you receive the subscription ID, you can check that the subscription is in the running state. While you can use the data as it becomes available to start building your analysis, running the subscription may take a while depending on factors such as the size of your AOI and the time range.

# Get the subscription ID
sub_id = requests.get(pv_subscription, auth=auth).json()['id']
sub_id

# Use sub_id to get the subscription state
def get_sub_status(sub_id, auth):
    sub_url = BASE_URL + '/' + sub_id
    sub_status = requests.get(sub_url, auth=auth).json()['status']
    return sub_status

# Note: Running the subscription may take a while 
# depending on the size of your AOI and the time range
sub_status = get_sub_status(sub_id, auth)
sub_status

Next, you retrieve data in CSV format from a specified URL using an API request. Then read the CSV data into a Pandas DataFrame. Here, you filter the DataFrame to include only rows where the month of item_datetime falls between May and November. You can also filter the DataFrame to keep only rows with valid data, excluding any rows with null or zero values for bp.band-1.valid_percent, as well as rows with a status of QUEUED. Finally, view the first few rows of the DataFrame to examine the data.

# Retrieve the resulting data in CSV format. 
resultsCSV = requests.get(f"{BASE_URL}/{sub_id}/results?format=csv", auth=auth)

# read the CSV data into a text file
with open('results.csv', 'w') as f:
    f.write(resultsCSV.text)

# Read CSV Data
df = pd.read_csv(StringIO(resultsCSV.text), parse_dates=["item_datetime", "local_solar_time"])

# Ensure 'item_datetime' is in datetime format and remove timezone
df['item_datetime'] = pd.to_datetime(df['item_datetime']).dt.tz_localize(None)

# Filter rows where the month of 'item_datetime' is between May and November
df = df[(df['item_datetime'].dt.month >= 5) & (df['item_datetime'].dt.month <= 11)]

# Filter by valid data only
df = df[df["bp.band-1.valid_percent"].notnull()]
df = df[df["bp.band-1.valid_percent"] > 0]
df = df[df["status"] != 'QUEUED']

df.title = subscription_desc["name"]

df.head()

Analyzing the data from Planet

Now, you are ready to define the mean and standard deviation, to determine the threshold of an anomaly, and to plot the results.

# Calculate the mean and standard deviation
mean_value = df["swc.band-1.mean"].mean()
std_dev = df["swc.band-1.mean"].std()

# Define the threshold as 3 standard deviations below the mean
anomaly_threshold = mean_value - (3 * std_dev)

# Find anomalies
anomalies = df[df["swc.band-1.mean"] < anomaly_threshold]
anomalies

# Plot the line chart
df.title = subscription_desc["name"]

ax = df.plot.line('local_solar_time', 'swc.band-1.mean', title=df.title, figsize=(10, 6))

# Scatter plot for anomalies
ax.scatter(anomalies.local_solar_time, anomalies["swc.band-1.mean"], color='red', label='Anomaly')

# Add labels to the anomalies
for index, row in anomalies.iterrows():
    ax.annotate(f'{row["swc.band-1.mean"]}\n{row["local_solar_time"].strftime("%Y-%m-%d")}', (row['local_solar_time'], row['swc.band-1.mean']), 
                xytext=(5, 10), textcoords='offset points', color='red')

# Display the plot
plt.legend()
plt.show()


Learning Resources

Planet Soil Water Content Technical Specification provides the technical specification for this product. Get Started with Planet APIs. Find a collection of guides and tutorials on Planet University. Also checkout Planet notebooks on GitHub, such as the Subscriptions tutorials: subscriptions_api_tutorial.


Rate this guide: