Planetary Variables are available via the Planet Subscriptions API.
Additional Planet API Documentation
Find more information in the API Reference and check out usage examples in these Jupyter Notebooks.
Getting Started with Planetary Variables Subscription
Once your Planet account is provisioned with the desired Planetary Variable:
- Upload your AOIs to Features Manager
- Reserve PV quota for your AOIs
- Install Planet SDK
- Sign on to your account
Subscribing with Planet SDK command-line interface
The planet subscriptions command enables easy interaction with the Subscriptions API. The no code command-line interface (CLI) is explained in Subscriptions API Tutorial. The steps are:
- Generate a Planetary Variable subscription source with
request-pv - Generate a subscriptions request with
request - Create and monitor a subscription with
createandget - Finally, you are able to retrieve the data with
results
Step 1 - Generate a Planetary Variable Subscription Source
The request-pv command constructs the source part of a Planetary Variable request.
For a given Planetary Variables type (--var-type) and id (--var-id), the subscription is defined with --geometry, --start-time, and --end-time (optional) parameters. Planetary Variables type and id are available in the section #planetary-variables-types-and-ids.
In the example below, we are subscribing to Crop Biomass Version 4.0 starting on 2022-08-24 and with no end date.
planet subscriptions request-pv --var-type biomass_proxy --var-id BIOMASS-PROXY_V4.0_10 \
    --geometry pl:features/my/sf_feature_collection-2q26z0q/mX9dB1o --start-time 2022-08-24T00:00:00-07:00 > request-pv.json
Step 2 - Generate a Subscription Request
After the creation of the request-pv.json file, the request command will generate the JSON payload file (example).
Raster delivery is optional for Planetary Variables subscriptions. For users that only want to receive time series data, Planetary Variables subscriptions do not require cloud delivery of rasters files. If rasters or vectors outputs are desired, --delivery cloud-delivery.json can be added for delivery to a cloud storage or --hosting sentinel_hub if the subscribed data is hosted on Sentinel Hub.
planet subscriptions request --name 'First Subscription' --source request-pv.json > my-subscription.json
Step 3 - Submit and Monitor a Subscription
The subscription, as described in my-subscription.json, is submitted with the create command. The response will be displayed and a unique subscription identifier ID will be created (e.g., 518b802e-919f-41c6-a068-b8d740b9e64a).
planet subscriptions create my-subscription.json
The get command outputs the subscription description, including the status (see status definitions).
planet subscriptions get 518b802e-919f-41c6-a068-b8d740b9e64a --pretty | grep status
Step 4 - Get the Results of a Subscription
This step allows you to save the time series data and other per-delivery metadata into a CSV file.
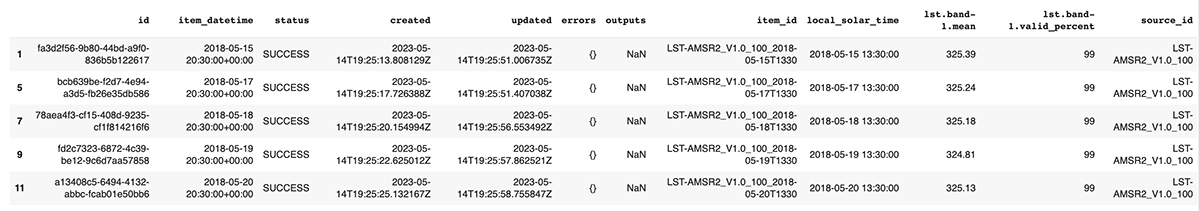
planet subscriptions results 518b802e-919f-41c6-a068-b8d740b9e64a --csv > my-subscription-results.csv
Planet SDK
More commands are available for interacting with the Subscriptions API and described in the CLI reference documentation.
Subscribing with Planet SDK for Python
The documentation is available via Planet SDK for Python.
Description of the JSON Payload
The JSON payload of the request must specify these required parameters:
| Parameters | Descriptions |
|---|---|
| name | User-defined free text identifier for the subscription |
| source.type | Planetary Variables data product type |
| source.parameters.id | Planetary Variables data product identifier (id) |
| source.parameters.start_time | Date and time when the subscription begins |
| source.parameters.geometry | Area of interest (AOI) |
| source.parameters.end_time [optional] | Date and time when the subscription ends (optional) |
| delivery [optional] | Cloud storage location (optional) |
| hosting [optional] | Hosting configuration (optional) |
Find your product parameters
The Planetary Variables source.type, source.parameters.id and source.parameters.start_time are described in #planetary-variables-types-and-ids and delivery and hosting are explained in #data-delivery.
Here is an example of a JSON payload for SWC-AMSR2-X_V5.0_1000 over San Francisco using a Feature Reference ID between December 7th, 2022 and December 16th, 2022, and delivery of raster files to a Google Cloud Bucket.
{
   "name": "Soil Moisture SWC-AMSR2-X_V5.0_1000 - SF",
   "source": {
       "type": "soil_water_content",
       "parameters": {
           "id": "SWC-AMSR2-X_V5.0_1000",
           "start_time": "2022-12-07T00:00:00Z",
           "end_time": "2022-12-16T00:00:00Z",
           "geometry": {
               "content": "pl:features/my/sf_feature_collection-2q26z0q/mX9dB1o",
               "type": "ref"
           }
       }
   },
   "delivery": {
       "type": "google_cloud_storage",
       "parameters": {
           "bucket": "example-bucket",
           "credentials": "<REDACTED>"
       }
   }
}
Data Delivery
Planetary Variables have main three options for the data delivery.
Option 1 - Data hosted on Sentinel Hub
Subscriptions can be delivered to a Sentinel Hub Collection by using the --hosting sentinel_hub and --collection-id flags.
The --collection_id is optional. If you decide to use this, ensure that the subscription request and the collection have matching bands. If you're unsure, allow the system to create a new collection for you by omitting the --collection_id option. This will ensure the newly set up collection is configured correctly, and you can subsequently add items to this collection as needed.
All Planetary Variables are supported for this option.
Option 2 - Raster data delivered to user cloud storage
Soil Water Content, Land Surface Temperature, Forest Carbon, and Crop Biomass provide raster assets that are clipped to the subscription’s AOI. Field Boundaries provides vector assets, also clipped to the AOI.
Delivery destination can be specified using the delivery parameter. The Subscriptions API supports delivery of rasters to Amazon S3, Microsoft Azure Blob Storage, Google Cloud Storage, or Oracle Cloud Storage (all supported cloud delivery options are described in here).
Here is an example of a JSON payload for delivery to Google Cloud:
{
    "type": "google_cloud_storage",
    "parameters": {
        "bucket": "your-gcs-bucket",
        "credentials": "c29tZWNyZWRzZm9yeW91cmdjc2J1Y2...",
        "path_prefix":"optionalsubfolder1/optionalsubfolder2"
    }
}
All Planetary Variables are supported for this option.
Option 3 - Time series-only delivery
Time series data is available for all subscriptions. It is also possible to only receive time series data and not require cloud storage by simply omitting the delivery parameter when creating a subscription. The time series data includes two statistics:
- valid_percent: Integer from 0 - 100
- mean: Floating point with two fractional digits (these are digits after decimal point)
Status Descriptions
Status definitions are provided here.
Planetary Variables Types and IDs
Crop Biomass
| Source Type | Source id | Geographical Coverage | Time Range (YYYY-MM-DD) | AOI size limit (sqkm) |
|---|---|---|---|---|
| biomass_proxy | BIOMASS-PROXY_V4.0_10 | Global | 2019-01-01 to present | 30 |
Data is delivered within 12 hours after data acquisition which is at 00:00 local solar time.
You can find more information about the product on the Crop Biomass product page.
Field Boundaries
| Source Type | Source id | Geographical Coverage | Time Range (YYYY-MM-DD) | AOI size limit (sqkm) |
|---|---|---|---|---|
| field_boundaries_sentinel_2_p1m | FIELD_BOUNDARIES_v1.0.0_S2_P1M | Global | 2018-01-01 to present | None |
For each request you make using the subscriptions API, you'll get a dataset that includes field boundaries for the specified TOI and AOI.
You can find more information about the product on the Field Boundaries product page.
Forest Carbon Diligence
| Source Type | Source id | Geographical Coverage | Time Range (YYYY-MM-DD) | AOI size limit (sqkm) |
|---|---|---|---|---|
| forest_carbon_diligence_30m | CANOPY_HEIGHT_v1.1.0_30 | Global | 2013-01-01 to 2023-12-31 | 520,000 |
| forest_carbon_diligence_30m | CANOPY_COVER_v1.1.0_30 | Global | 2013-01-01 to 2023-12-31 | 520,000 |
| forest_carbon_diligence_30m | ABOVEGROUND_CARBON_DENSITY_v1.1.0_30 | Global | 2013-01-01 to 2023-12-31 | 520,000 |
For each request you make using the subscriptions API, you'll get a dataset that includes forest carbon estimations for the specified TOI and AOI.
More information about the product can be found on the Forest Carbon Diligence product page.
Forest Carbon Monitoring
| Source Type | Source id | Geographical Coverage | Time Range (YYYY-MM-DD) | AOI size limit (sqkm) |
|---|---|---|---|---|
| forest_carbon_monitoring_3m | CANOPY_HEIGHT_v1.0.0_3 | Global | 2020-12-21 to present | 8,000 |
| forest_carbon_monitoring_3m | CANOPY_COVER_v1.0.0_3 | Global | 2020-12-21 to present | 8,000 |
| forest_carbon_monitoring_3m | ABOVEGROUND_CARBON_DENSITY_v1.0.0_3 | Global | 2020-12-21 to present | 8,000 |
For each request you make using the subscriptions API, you'll get a dataset that includes forest carbon estimations for the specified TOI and AOI.
More information about the product can be found on the Forest Carbon Monitoring product page.
Land Surface Temperature
| Source Type | Source id | Geographical Coverage | Time Range (YYYY-MM-DD) | AOI size limit (sqkm) |
|---|---|---|---|---|
| land_surface_temperature | LST-AMSR2_V1.0_100 | Global | 2017-07-01 to present | 3,000,000 |
| land_surface_temperature | LST-AMSR2_V1.0_1000 | Global | 2012-07-25 to present | None |
| land_surface_temperature | LST-AMSRE_V1.0_1000 | Global | 2002-06-15 to 2011-10-04 | None |
Land Surface Temperature data is delivered within 12 hours after acquisition, which is at 01:30 and 13:30 Local Solar Time.
You can find more information about the product on the Land Surface Temperature product page.
Soil Water Content
| Source Type | Source id | Geographical Coverage | Time Range (YYYY-MM-DD) | AOI size limit (sqkm) |
|---|---|---|---|---|
| soil_water_content | SWC-AMSR2-C_V1.0_100 | Global | 2017-07-01 to present | 3,000,000 |
| soil_water_content | SWC-AMSR2-X_V1.0_100 | Global | 2017-07-01 to present | 3,000,000 |
| soil_water_content | SWC-SMAP-L_V1.0_100 | Global | 2017-07-01 to present | 3,000,000 |
| soil_water_content | SWC-AMSR2-C_V2.0_100 | Global | 2017-07-01 to present | 3,000,000 |
| soil_water_content | SWC-AMSR2-X_V2.0_100 | Global | 2017-07-01 to present | 3,000,000 |
| soil_water_content | SWC-SMAP-L_V2.0_100 | Global | 2017-07-01 to present | 3,000,000 |
| soil_water_content | SWC-AMSRE-C_V4.0_1000 | Global | 2002-06-15 to 2011-10-04 | None |
| soil_water_content | SWC-AMSRE-X_V4.0_1000 | Global | 2002-06-15 to 2011-10-04 | None |
| soil_water_content | SWC-AMSR2-C_V4.0_1000 | Global | 2012-07-25 to present | None |
| soil_water_content | SWC-AMSR2-X_V4.0_1000 | Global | 2012-07-25 to present | None |
| soil_water_content | SWC-SMAP-L_V4.0_1000 | Global | 2015-04-01 to present | None |
| soil_water_content | SWC-AMSRE-C_V5.0_1000 | Global | 2002-06-15 to 2011-10-04 | None |
| soil_water_content | SWC-AMSRE-X_V5.0_1000 | Global | 2002-06-15 to 2011-10-04 | None |
| soil_water_content | SWC-AMSR2-C_V5.0_1000 | Global | 2012-07-25 to present | None |
| soil_water_content | SWC-AMSR2-X_V5.0_1000 | Global | 2012-07-25 to present | None |
| soil_water_content | SWC-SMAP-L_V5.0_1000 | Global | 2015-04-01 to present | None |
Soil Water Content is delivered within 12 hours after acquisition, which is at 06:00 Local Solar Time (L band) and 01:30 Local Solar Time (C and X band).
You can find more information about the product on the Soil Water Content product page.
Vegetation Optical Depth
| Source Type | Source id | Geographical Coverage | Time Range (YYYY-MM-DD) | AOI size limit (sqkm) |
|---|---|---|---|---|
| vegetation_optical_depth | VOD-AMSRE-C_V4.0_1000 | Global | 2002-06-15 to 2011-10-04 | None |
| vegetation_optical_depth | VOD-AMSRE-X_V4.0_1000 | Global | 2002-06-15 to 2011-10-04 | None |
| vegetation_optical_depth | VOD-AMSR2-C_V4.0_1000 | Global | 2012-07-25 to present | None |
| vegetation_optical_depth | VOD-AMSR2-X_V4.0_1000 | Global | 2012-07-25 to present | None |
| vegetation_optical_depth | VOD-SMAP-L_V4.0_1000 | Global | 2015-04-01 to present | None |
Vegetation Optical Depth is delivered within 12 hours after acquisition, which is at 06:00 Local Solar Time (L band) and 01:30 Local Solar Time (C and X band).
We are continually working to improve our technical documentation and support. Please help by sharing your experience with us.