Subscriptions API for Daily Agriculture Monitoring
By: Matt Ballard on May 12 2022
Use the Subscriptions API for scouting, performance, precision applications, and more.
The Subscriptions API
At Planet, our satellites capture near-daily imagery of Earth’s entire landmass. You can use this data to build monitoring solutions for everything from directed field scouting to field performance monitoring to precision applications and more. The historical archive data that Planet has collected can be used to gather historical context, train models, and perform time-series analysis. For these persistent, always-on monitoring solutions, we provide the Subscriptions API to make it easier for you to integrate Planet data into your solutions.
With a single API call, the Subscriptions API allows you to subscribe to a continuous delivery of imagery to the cloud of your choice. You can set it up so you only receive data you’re interested in by making use of filters for your area of interest (AOI), time of interest (TOI), and more. As new imagery is added to our catalog, the Subscriptions API automatically checks to see if it meets your criteria. If it does, imagery is sent directly to your cloud storage destination. This significantly reduces the complexity of building a monitoring solution. You don’t need to build your own infrastructure or application for polling an API to search for newly available data.
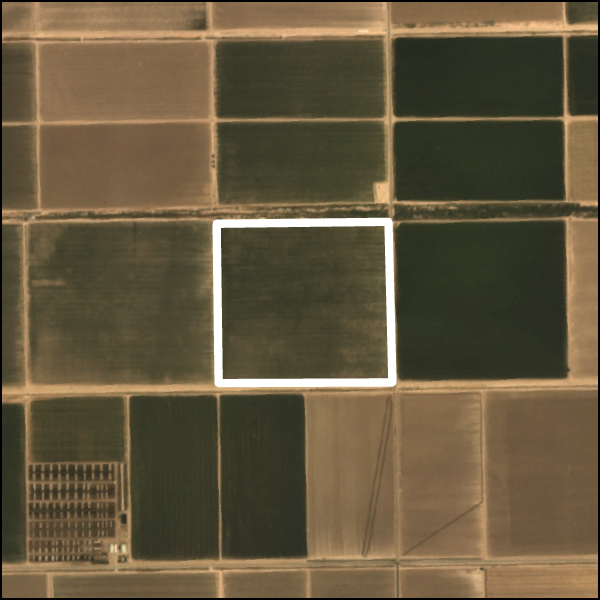
Let’s take, for example, a solution for monitoring the health and performance of an agricultural field. Below is a sample API request over our field AOI for the 2018-2022 growing seasons:
        POST https://api.planet.com/subscriptions/v1/
        {
          "name": "Agriculture Field 12345",
          "source": {
          "type": "catalog",
          "parameters": {
          "geometry": {
              "coordinates": [[[-115.43197,32.924028],
              [-115.42354,32.923947],
              [-115.423616,32.93051],
              [-115.431959,32.930542],
              [-115.43197,32.924028]]],
              "type": "Polygon"
          },
          "start_time": "2018-03-01T00:00:00Z",
          "end_time": "2022-11-01T00:00:00Z",
          "rrule": "FREQ=MONTHLY;BYMONTH=3,4,5,6,7,8,9,10",
          "item_types": ["PSScene"],
          "asset_types": ["ortho_analytic_8b"]
          }
          },
            "delivery": { ... }
        }
|
|
For the above order, the TOI spans from our start date, March 1, 2018, until our end date, November 1, 2022. If you are not interested in monitoring during off-season months, you can use Recurrence Rules (rrule) to filter for data from certain months. In the above example, we set a rule to send data only during the months between March (3) and October (10). This reduces the volume of data by not sending off-season data to your cloud.
The TOI is set to include data from previous growing seasons to use as a baseline for analysis of this growing season. For example, you could use the historical data to identify areas of persistent under-performance within a field. Or, you can use this data for time series analysis, identifying dates when events like tilling, planting, or harvesting occurred. As part of Planet’s Area Under Management (AUM) offering, you have access to Planet’s archive for the areas that you choose to monitor at no additional cost.
When you place an order for a timeframe which includes dates that have already passed, the order is “backfilled.” In other words, historical imagery from Planet’s archive for your TOI is sent to your cloud storage at the time of order. If your TOI extends into the future, imagery is delivered to your cloud storage as it is added to Planet’s catalog in what we call “forward fill.”
Raster processing with Subscriptions API tools
Remote sensing data requires a significant amount of processing to be turned into a usable form. Planet handles much of the preprocessing, including radiometric calibration, orthorectification, and more. To further help with preprocessing, the Subscriptions API supports a collection of tools that can prepare your data prior to cloud delivery. Below is a list of currently supported tools:
| Tool | Description |
|---|---|
| Harmonize | Harmonize PlanetScope imagery with Sentinel-2. |
| Top of Atmosphere Reflectance (TOAR) | Convert Analytic assets from radiance to reflectance. |
| Clip | Clips imagery assets to your area of interest. |
| Reproject | Reproject, resample, and rescale imagery products to a new projected coordinate system and resolution. |
| Band Math | Apply mathematical expressions using the spectral bands of Planet imagery to produce outputs and indices. |
These tools help to leverage PlanetScope data for visualization and analysis. For example, in agricultural field monitoring applications, the Clip tool is critical for reducing the size of the data because the area of a field is likely much smaller than the area of a PlanetScope scene. The Clip tool clips the rasters that are delivered to the extent of your AOI, as defined in your parameters when you create a Subscription. By clipping the data, you can reduce your cloud storage costs, analyze data faster, and visualize data in mapping applications more efficiently and effectively.
The Harmonize tool adjusts the Surface Reflectance measurements from PlanetScope instruments to align them with Sentinel-2. The tool is helpful when performing analysis across multiple PlanetScope sensor types from archive data because it minimizes scene-to-scene and sensor-to-sensor variability. This tool is especially useful when working with Dove Classic data as newer Doves, including SuperDoves, are already closely aligned with Sentinel-2. However, this tool has caveats and should be tested in your area of interest as it may not work as well in areas of rapid change (agricultural fields) or when scenes include bodies of water. For more information, please read: Scene Level Normalization and Harmonization of Planet Dove Imagery.
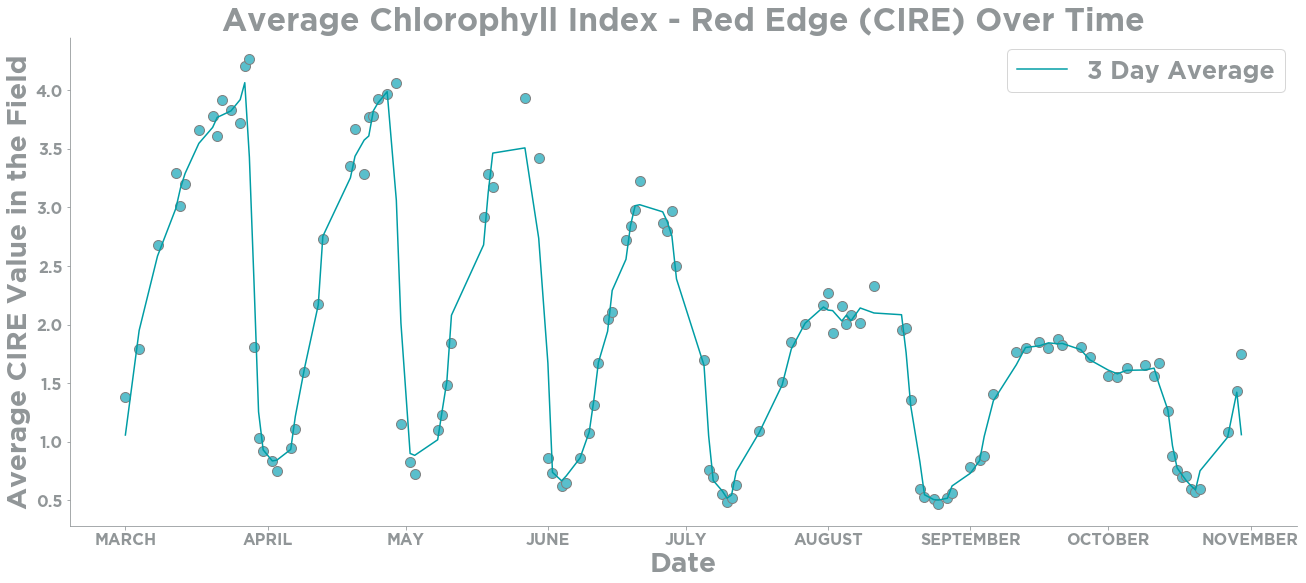
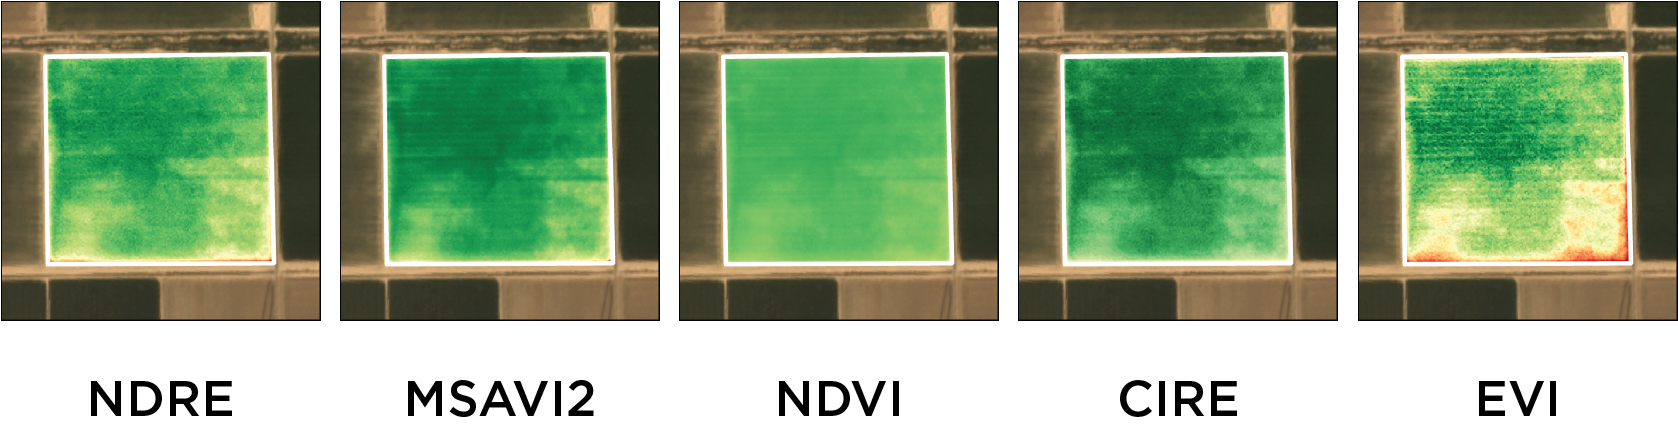
Another very useful tool for agriculture is Band Math. PlanetScope imagery captured by the SuperDove fleet includes 8 spectral bands which can be used for true color and false color visualizations. The Band Math tool in the Subscriptions API enables you to perform calculations using the different spectral bands and store the resulting values in a new raster. These 8 spectral bands can also be used to create indices such as:
| Acronym | Index Name | Formula |
|---|---|---|
| NDVI | Normalized Difference Vegetation Index | ( NIR - R ) / ( NIR + R ) |
| NDRE | Normalized Difference Red Edge | ( NIR - RedEdge ) / ( NIR + RedEdge ) |
| CIRE | Chlorophyll Index Red Edge | ( ( NIR / RedEdge ) - 1 ) |
| MSAVI2 | Modified Soil-adjusted Vegetation Index 2 | ( 2 * NIR + 1 - sqrt ( ( 2 * NIR + 1 ) ^ 2 - 8 * ( NIR - RED ) ) ) / 2 |
| EVI | Enhanced Vegetation Index | 2.5 * ( NIR - RED ) / ( NIR + 6 * R - 7.5 * B + 1 ) |
Band Math creates an additional imagery output file which supports up to 15 bands with different calculations. Computation for calculating indices is completed before the imagery arrives in your cloud storage, reducing the time and steps you need to take to build your final solution.
Cloud Delivery & Format
Now that we have created a Subscription for our AOI & TOI, and we have defined our processing tools, we are ready to deliver the data. When you create a Subscription you need to define your cloud storage destination from one of the supported delivery options. Using the File Format tool, you can also specify the file format for the rasters that are delivered as Cloud Optimized GeoTiffs (COGs). COGs are a Cloud Native Geospatial data format which is an efficient file format for on-the-fly processing and geospatial visualization. They enable any tool or client to request portions of the file based on the area of interest.
By utilizing the Subscriptions API, you are able to set up a regular delivery of satellite imagery to your cloud storage on a near-daily basis. The imagery can be filtered to fit your criteria and processed to your specifications prior to delivery. The Subscriptions API can reduce the cost and effort needed to prepare your data to be ready for visualization and analysis, ultimately reducing the time it takes for data to reach its end-users for decision making.

Next steps…
The Subscriptions API can be a powerful tool for use-cases where you need historical data and/or ongoing monitoring, making it highly valuable for agriculture monitoring. You can find documentation for the Subscriptions API in the Developer Center and sample notebooks for using the Subscriptions API in our GitHub repo. Also subscribe to our Developer Newsletter and get more information like this!
On this Earth Day: Join NICFI Satellite Data Program and Access Planet HiRes Tropical Data
By: Luisa Teixeira on April 21 2022
Join NICFI & Access Planet HiRes Tropical Data
Half a century ago, the first Earth Day started an environmental revolution. Since then, many strategies, movements, and actions have been taken to create a more sustainable future. This year, 2022, Earth Day is focused on the engagement of “more than 1 billion people, governments, institutions, and businesses to recognize our collective responsibility and to help accelerate the transition to an equitable, prosperous green economy for all.”
Tropical forests are a critical element in the balance of the global systems. Its loss is not only a major cause of climate change and mass extinction, but also of rising social inequality and instability. In September 2020, the NICFI Satellite Data Program, envisioned by Norway’s International Climate and Forest Initiative (NICFI) started providing free access to satellite images of the tropics to anyone, anywhere. The program was implemented by Kongsberg Satellite Services (KSAT), Airbus, and Planet.
The Program makes high-resolution (<5m per pixel) optical satellite data of the tropics available to all, for the purpose of helping stop deforestation and combat climate change. This includes PlanetScope Visual Mosaics and PlanetScope Surface Reflectance Mosaics from 2015 onwards.
To celebrate this year’s Earth Day theme, “everyone accounted for, and everyone accountable,” we would like to invite you to join the NICFI Satellite Data Program, and to gain access to high-resolution satellite images of the tropics and to take action:
- reduce and reverse the loss of tropical forests
- combat climate change
- conserve biodiversity
- contribute to forest regrowth, restoration and enhancement
- facilitate sustainable development
Dive into the NICFI Satellite Data Program resources
The NICFI Satellite Data Program is making available satellite data over the tropics going back to 2015. There are more than ten thousand registered users, representing more than 145 countries, that have collectively streamed or downloaded more than 30 millions of images. You can become part of this user community by signing up with NICFI Satellite Data Program at Planet.
After signing up, you can discover, preview, stream, and download Planet imagery data in the following interfaces:
- Planet APIs for direct access for searching, downloading and streaming web tiles
- QGIS or ArcGIS plugins to search and download data into desktop GIS tools
- Google Earth Engine integration to access Planet data directly in the GEE environment
- Geospatial data libraries like GDAL
- Planet Explorer for visualizing data online with Planet's web app
User ecosystem
Because satellite images can be used in many different ways and workflows, the NICFI Satellite Data Program serves a vast diversity of individual and organization users with varying degrees of technical expertise.
Purpose Allies
NICFI’s Purpose Allies are key to help amplify the reach and impact of the program by developing tools, promoting knowledge transfer and capacity building in response to specific user group needs. Despite sharing common goals, each Purpose Ally has a different target audience and technical approach, making up an interesting collection of geospatial platforms and tools: Global Forest Watch, Mapbiomas, Sentinel Hub, and UN-FAO’s SEPAL & Collect Earth.
Global Forest Watch
Global Forest Watch (GFW) “is an online platform that provides data and tools for monitoring forests. By harnessing cutting-edge technology, GFW allows anyone to access near real-time information about where and how forests are changing around the world.” Through GFW, the Planet-NICFI basemaps have been visited more than 170 thousand times since the beginning of the program. MapBuilder allows users to “combine their own datasets with GFW’s cutting-edge data and analysis tools” in ArcGIS Online. The source code for GFW is on GitHub, available under a MIT License.
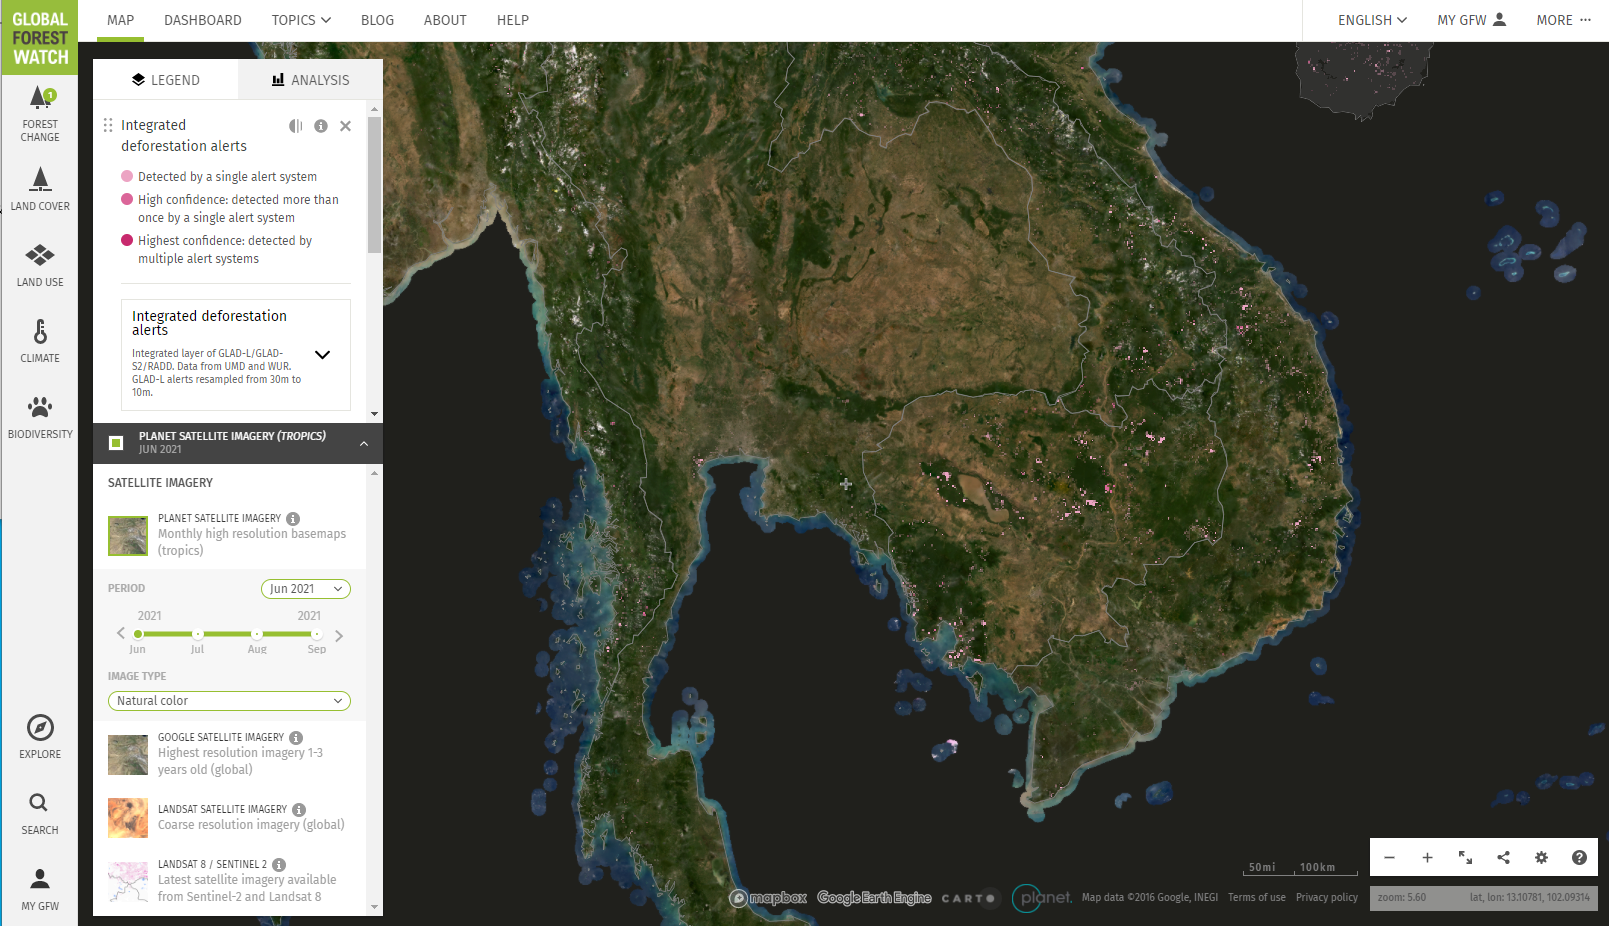 Planet-NICFI basemap in GFW showing natural color contextualization of integrated deforestation alerts in Mainland Southeast Asia
Mapbiomas
MapBiomas is a network of land use and biomes experts, remote science specialists and computer scientists dedicated to map and monitor all land cover and land use changes happening in Brazil, Indonesia and throughout South America. Besides integrating the Planet-NICFI basemaps into their land cover and land use platform they develop a series of scripts, tools and plugins dedicated to land cover land use maps based on multiple geospatial data and technologies.
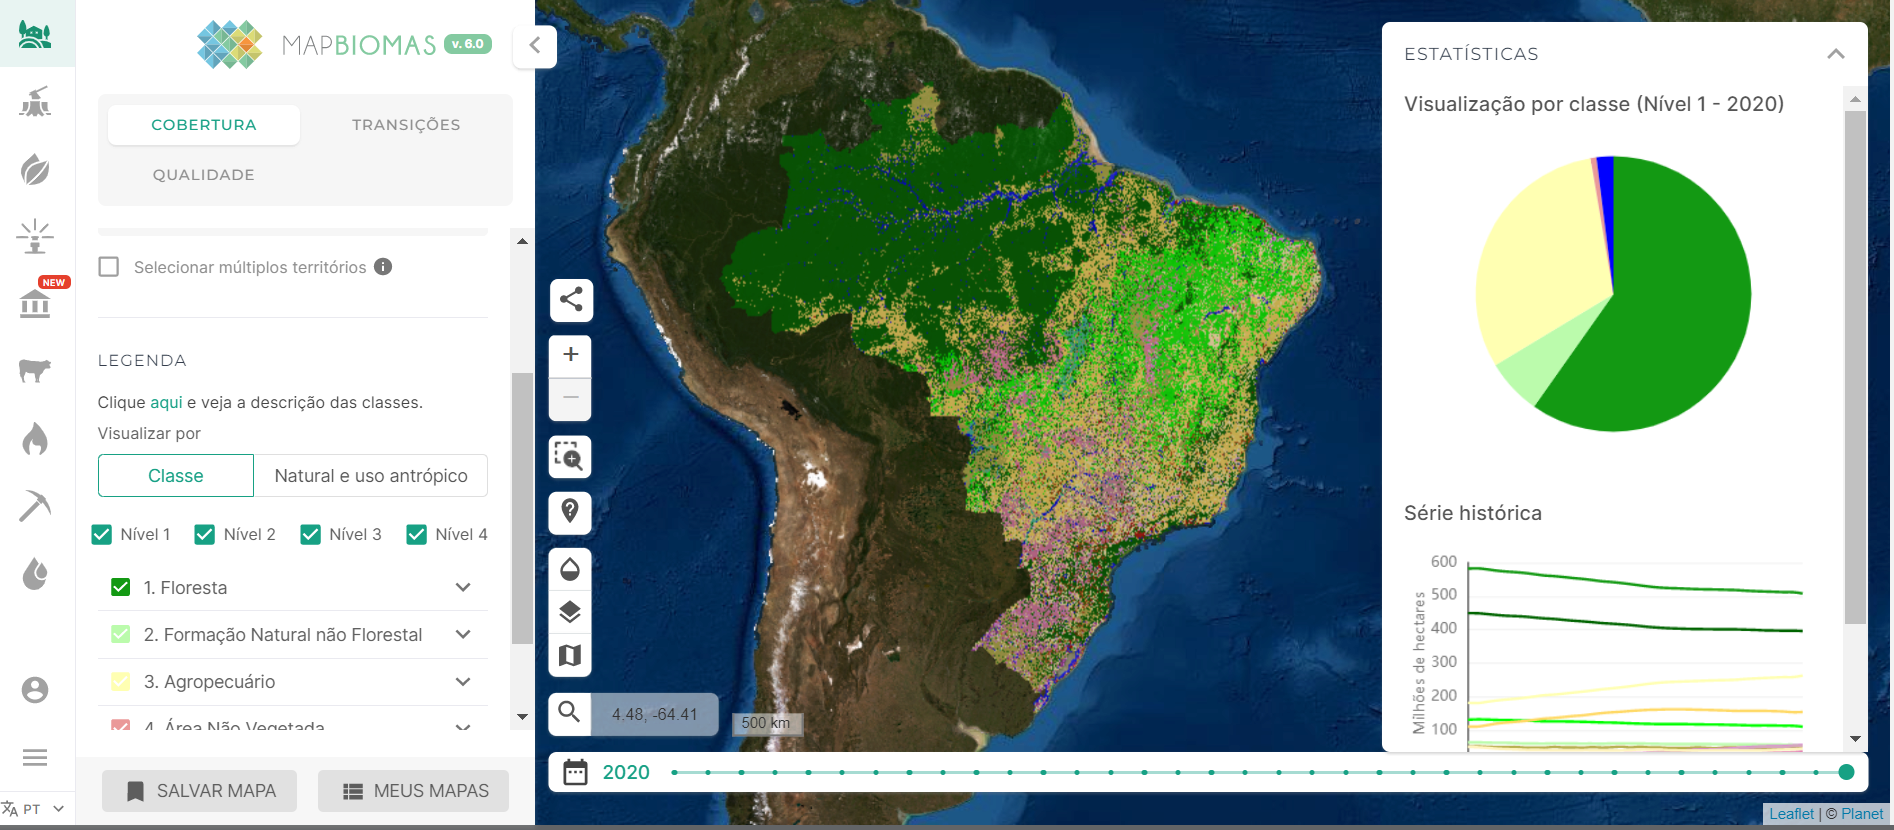 Mapbiomas displaying Brazil land use/land cover data overlaid on NICFI Tropical basemap
Sentinel Hub
Sentinel Hub is a cloud-based API that makes Earth Observation imagery seamlessly accessible for browsing, visualization and analysis, directly in one’s existing application or machine learning workflow. In addition to providing tech and extensive documentation, Sentinel Hub offers open source code and regularly organizes competitions for its developer community.
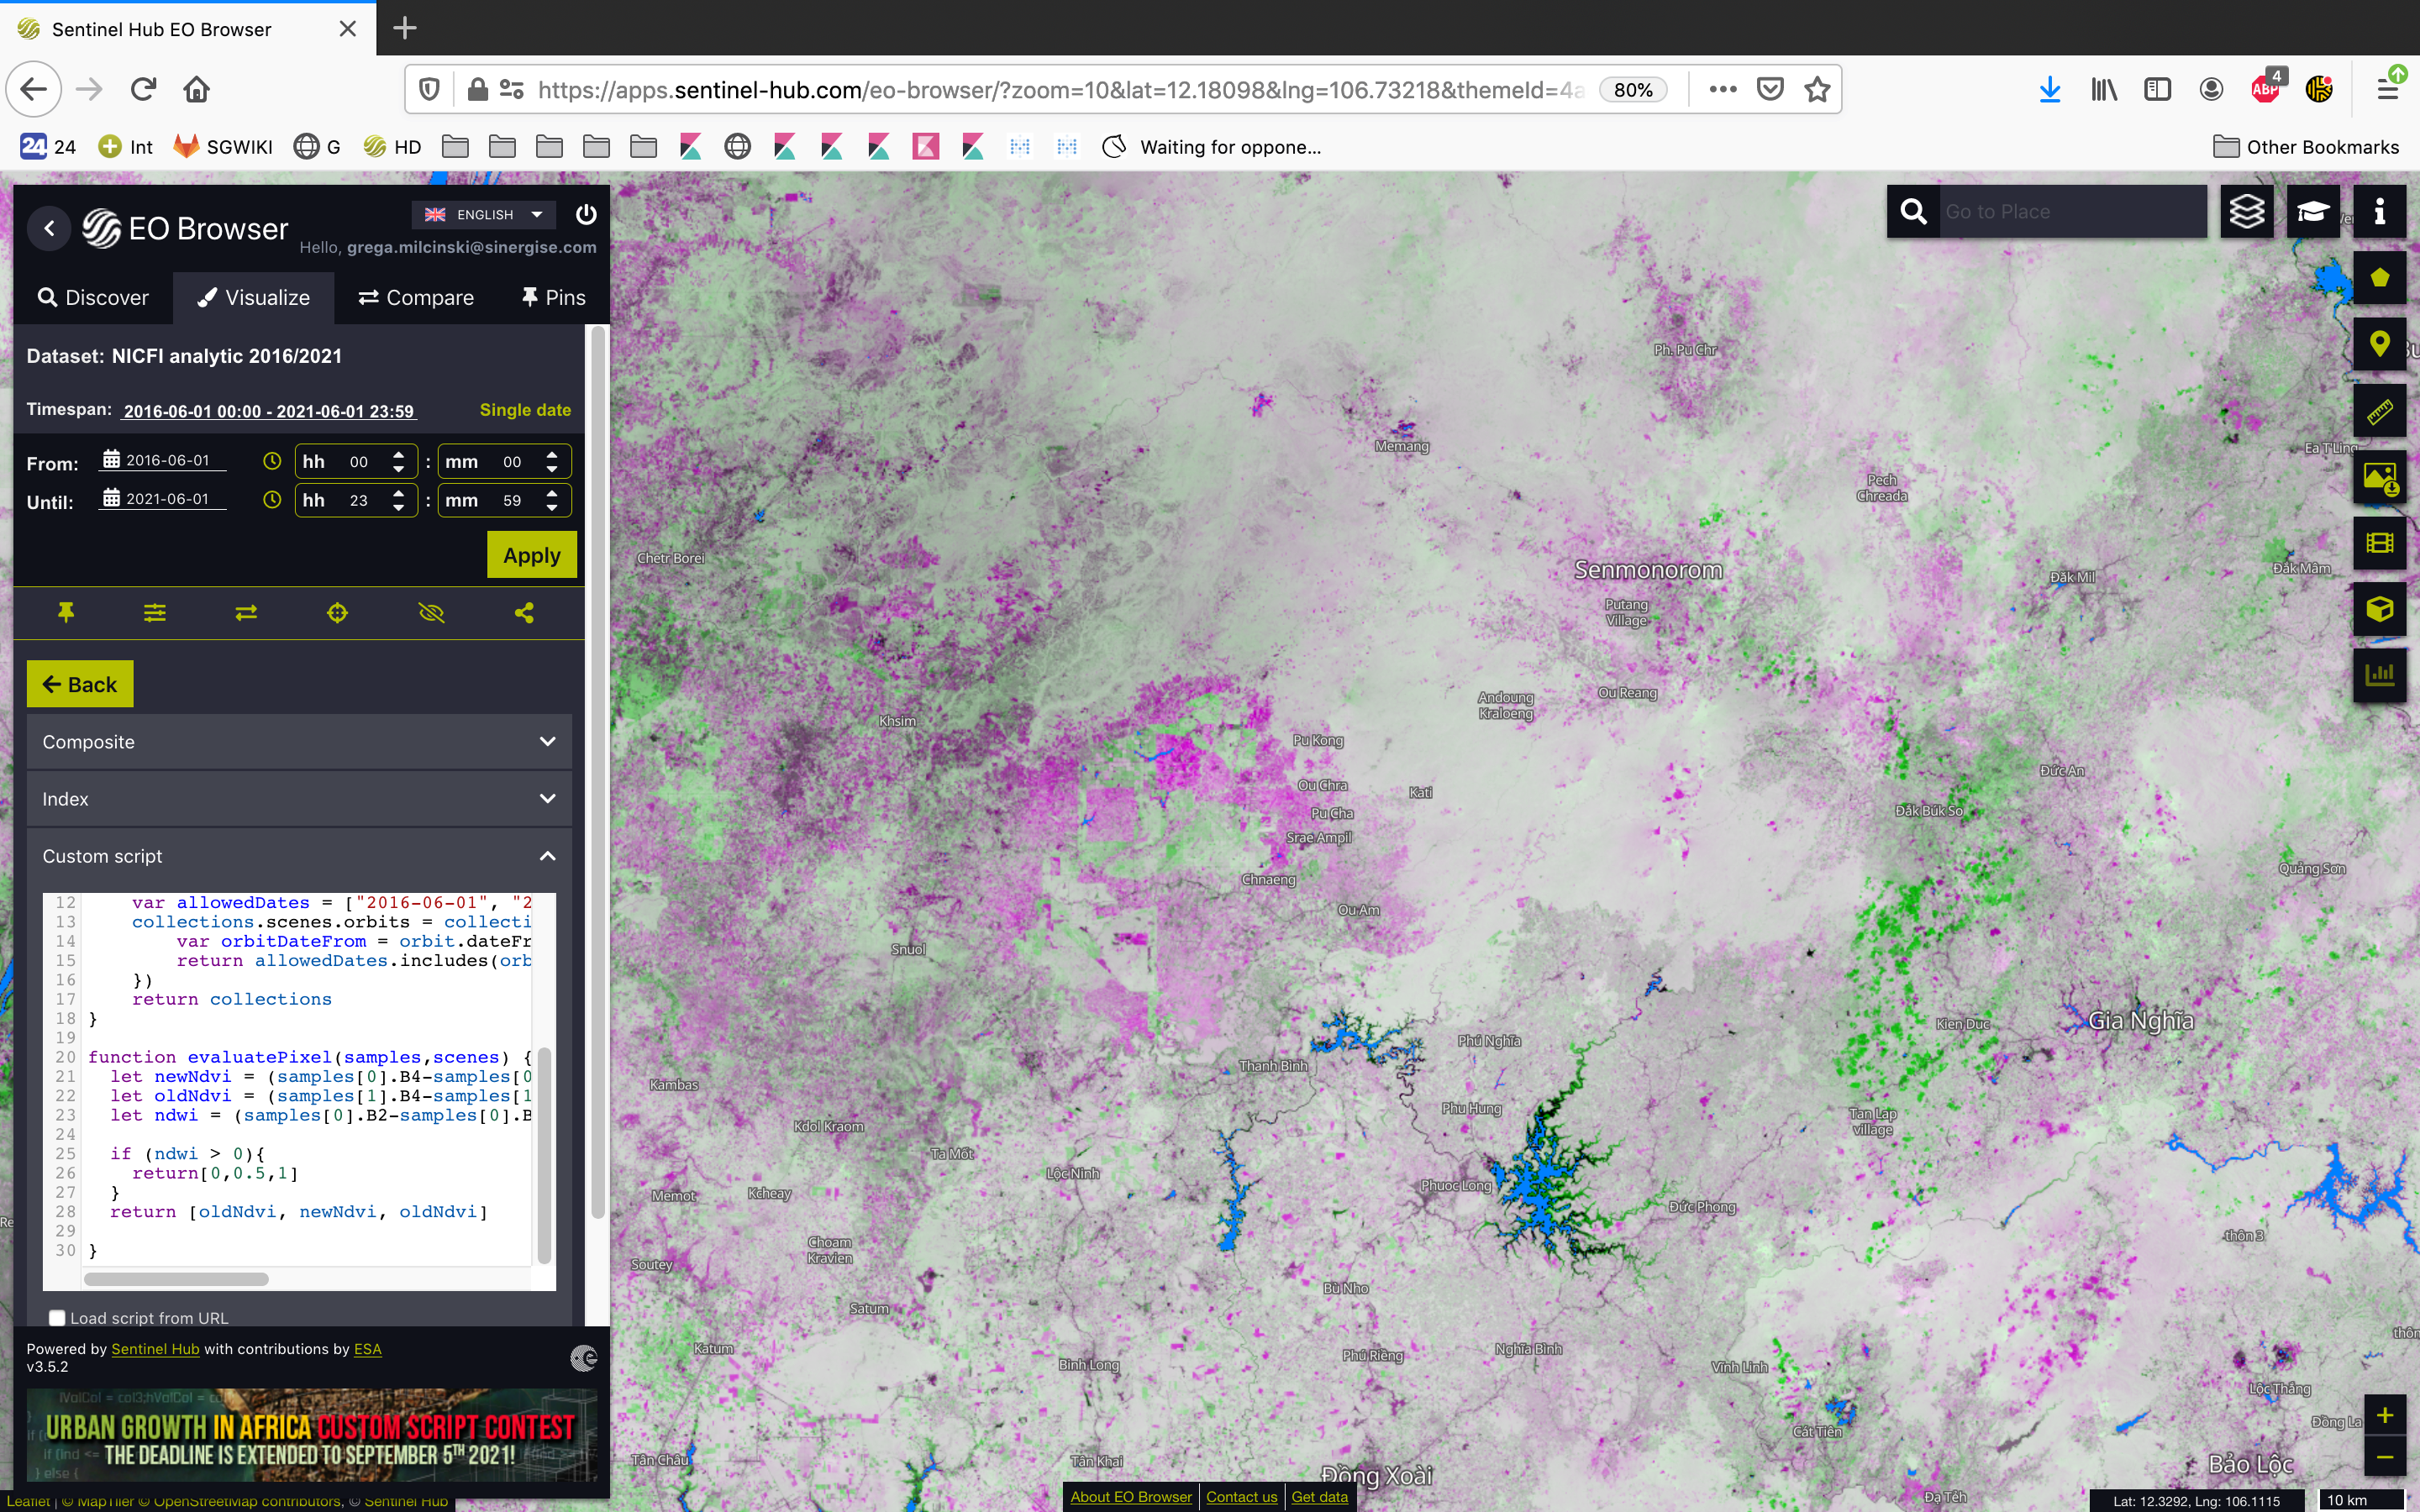 Planet-NICFI imagery data processing within Sentinel Hub’s EO Browser for the identification of areas with change of vegetation over time
UN-FAO
UN-FAO, “in collaboration with over 70 countries and partners, has developed a suite of [open source] innovative forest and land monitoring tools, conceived to meet the urgent need for (national and local) systems that enable accurate yet cost-effective measurement, monitoring, and reporting of forest and other land cover.” SEPAL and Collect Earth, two of the Open Foris tools, now integrate Planet-NICFI data that can be used by “over 9,000 users from 185 countries” to monitor and report on their ecosystems, namely for the UNFCCC.
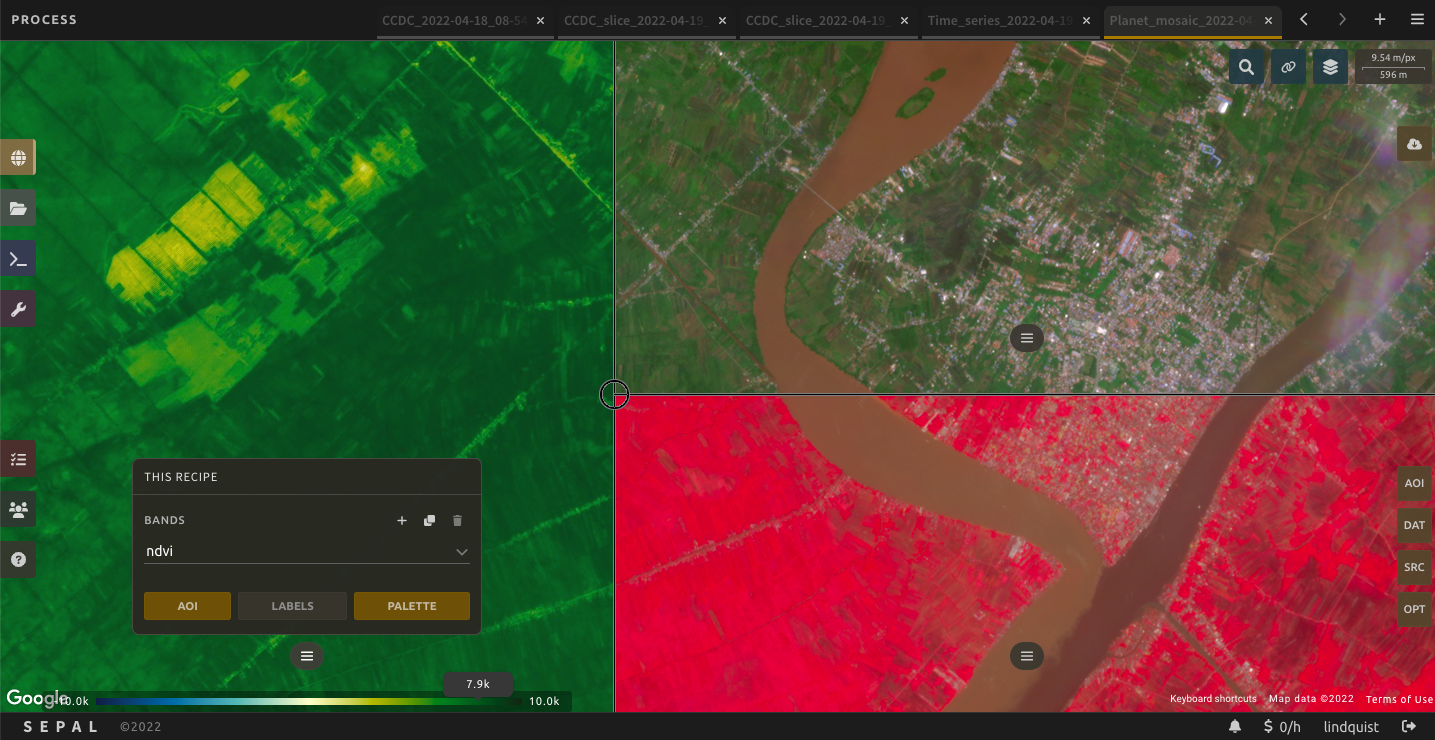
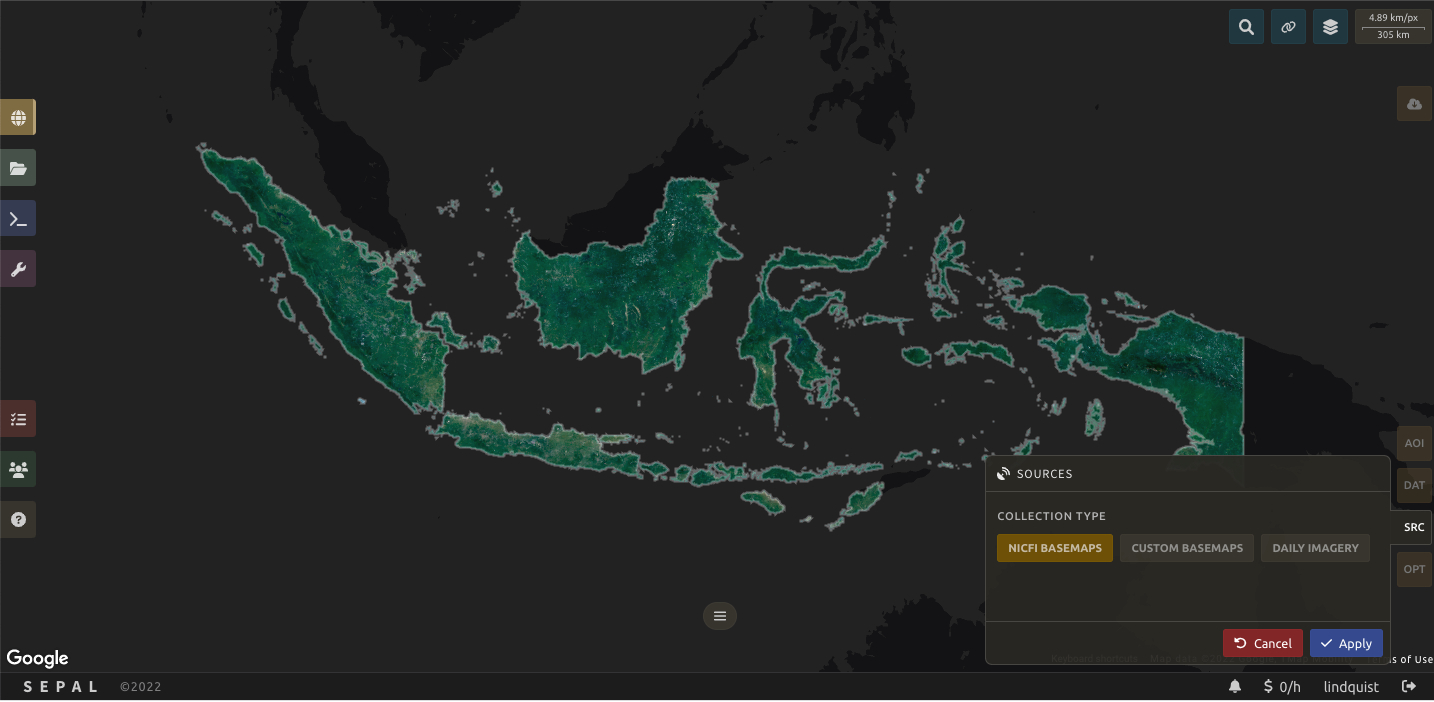 SEPAL interface with NICFI-Planet basemaps
Platform Partners
The NICFI Satellite Data Program has been proactively working to establish collaboration to further increase its reach, as well as to elevate its users' resources and efforts. Acknowledging that there is no unique solution to our planet’s problems, the Program tries to engage and adjust to the strategies that different sectors of activity may adopt in their efforts to tackle deforestation, biodiversity loss, and the climate crisis.
Google Earth Engine (GEE) supports geospatial processing at scale, powered by the Google Cloud Platform. In GEE you can find “petabyte-scale catalog of public and free-to-use geospatial datasets” including, since September 2021, the Planet NICFI Basemaps for Tropical Forest Monitoring. Moving data to GEE was enthusiastically received by the NICFI community of users, who are experimenting with time series algorithms like LandTrendr and deep learning with TensorFlow. Of about 11,000 registered NICFI registered users, currently more than 1,300 are using Google Earth Engine to analyze the Planet-NICFI Basemaps and benefiting from the speed and scale of hosted cloud computing. Any given day, there are between 400 and 600 active analyses of the high-resolution tropical monitoring data being run on the platform.
The GEO-Microsoft Planetary Computer partnership is supporting selected projects using the NICFI Satellite Data and the Planetary Computer to address environmental challenges. Microsoft’s Planetary Computer “combines a multi-petabyte catalog of global environmental data with intuitive APIs.”
And because communication is crucial to NICFI imagery users, the NICFI Satellite Data Program paired up with Mapbox to create a series of templates and step-by-step instructions for making custom web maps for displaying and comparing NICFI imagery, using Mapbox GL JS.
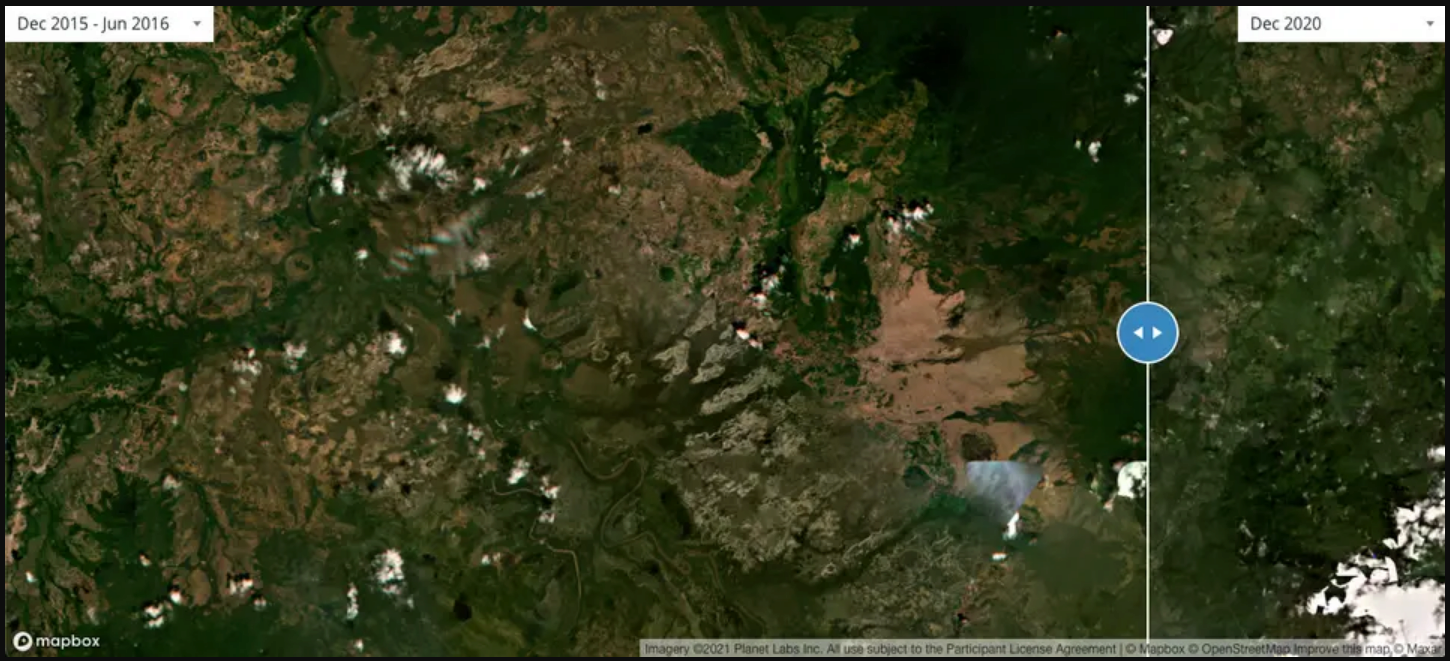 Mapbox GL JS template for swipe interaction to display two sets of Planet-NICFI imagery side-by-side for easy comparison
Here's the code snippet from the Mapbox NICFI Compare tutorial:
   // YOUR TURN: Set the center coordinates and zoom level for the 'before' map on the left
   const beforeMap = new mapboxgl.Map({
       container: "before",
       style: "mapbox://styles/mapbox/satellite-streets-v11",
       center: [2, -2],
       zoom: 2,
       hash: true
   });
   // YOUR TURN: Set the center coordinates and zoom level for the 'after' map on the right
   const afterMap = new mapboxgl.Map({
       container: "after",
       style: "mapbox://styles/mapbox/satellite-streets-v11",
       center: [2, -2],
       zoom: 2,
       hash: true
   });
   // YOUR TURN: Add your Planet NICFI API key
   const NICFI_API_KEY = "{YOUR_NICFI_API_KEY}";
Developer community
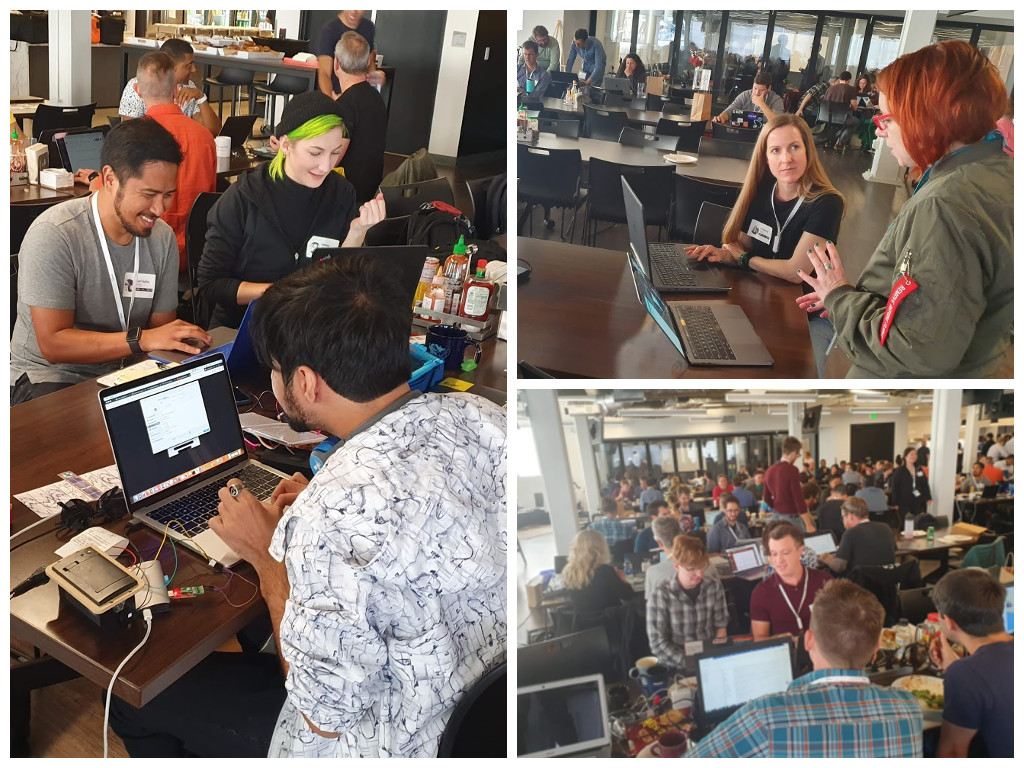
In the first year of the Program, the majority of the outreach activities, and training, were designed and directed at professionals working in the forestry, land use change and, generally speaking, earth observation industries. NICFI Satellite Data Program was the topic of a FOSS4G Session and Hackathon in October 2021, and featured in Geo for Good in November of the same year.
Your path to exploring NICFI data
With the most recent IPCC Report that concludes that we have less than a decade to reverse course on global emissions, this is the time to invest in our planet. This means our business, politics, and daily action all count. We have already achieved a lot, but we need better solutions, new approaches, and collaboration because we believe “Everyone accounted for, and everyone accountable.” And once again, to celebrate Earth Day 2022, we would like to propose your developer path to NICFI Satellite Data exploration on this Earth Day 2022:
- Sign up
- Get a Planet API key
- Download the tropical basemaps or quads to view NICFI mosaics
- Read through the NICFI User Guide, especially the NICFI Basemaps addendum
- Use the Planet Basemaps API to visualize imagery over time
- Check out other interfaces, such as the Google Earth Engine NICFI integration
- Reach out to nicfi-servicedesk@ksat.no if you have a question or need support regarding the NICFI Satellite Data Program.
Next steps
Learn more
Planet NICFI products and services
Get in touch with Planet Developer Relations
To get updates from the Planet Dev Rel team in the future, follow our blog feed.
To reach out to the Developer Relations team directly, send us an email via developers@planet.com.
Hello, World!
By: Sara Safavi on April 11 2022
Introducing Planet's new Developer Blog
Who are we?
We're Developer Relations at Planet: a team of curious geo-people, passionate space nerds, Pythonistas, educators and more (most of us wear multiple hats at once, too). We believe in using space to help life on earth, and the way we do that best is by empowering a global community of technical users (that's you!) to do amazing things with Planet's platform and data.
Who are you?
You'll notice that I said technical users above. We know that for many of you, the word "developer" doesn't necessarily capture all that you do. Many of you are Data Scientists or Analysts first. Others might be most comfortable labeling themselves as Remote Sensing or GIS professionals. And some of you may be developers exploring the potential of satellite imagery for the first time. We know, because the same can be said for our team and Planet as a whole. Planeteers come from a variety of backgrounds, each with a unique collection of skills and talents, as do you. The common thread here—and what we mean when we say "developer"—is using Planet's platform and data as a means to a greater end.
So whether you use Planet APIs, a Command Line Interface, GIS Integration or all of the above: you belong here.
Coming Soon
We've got an exciting collection of new content and resources heading your way over the next few months, including:
- An all-new Python SDK & CLI! A developer-first toolkit ready to integrate into your platform & workflows.
- NEW geo-friendly processes & examples!
- More Cloud-Native Geospatial tools! Native STAC support in Planet APIs, COG streaming, GIS integration support, and more.
Get in touch!
To get updates from the Planet Dev Rel team in the future, follow our blog feed.
To reach out to the team directly, send us an email via developers@planet.com.