By: Matt Ballard on May 12 2022
Use the Subscriptions API for scouting, performance, precision applications, and more.
The Subscriptions API
At Planet, our satellites capture near-daily imagery of Earth’s entire landmass. You can use this data to build monitoring solutions for everything from directed field scouting to field performance monitoring to precision applications and more. The historical archive data that Planet has collected can be used to gather historical context, train models, and perform time-series analysis. For these persistent, always-on monitoring solutions, we provide the Subscriptions API to make it easier for you to integrate Planet data into your solutions.
With a single API call, the Subscriptions API allows you to subscribe to a continuous delivery of imagery to the cloud of your choice. You can set it up so you only receive data you’re interested in by making use of filters for your area of interest (AOI), time of interest (TOI), and more. As new imagery is added to our catalog, the Subscriptions API automatically checks to see if it meets your criteria. If it does, imagery is sent directly to your cloud storage destination. This significantly reduces the complexity of building a monitoring solution. You don’t need to build your own infrastructure or application for polling an API to search for newly available data.
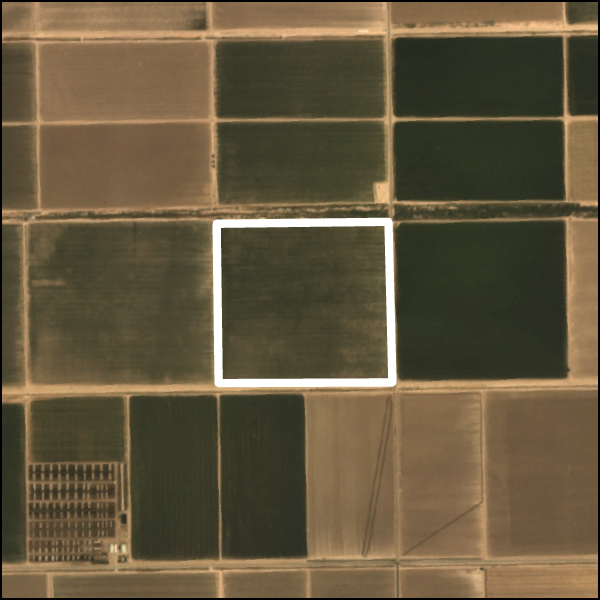
Let’s take, for example, a solution for monitoring the health and performance of an agricultural field. Below is a sample API request over our field AOI for the 2018-2022 growing seasons:
        POST https://api.planet.com/subscriptions/v1/
        {
          "name": "Agriculture Field 12345",
          "source": {
          "type": "catalog",
          "parameters": {
          "geometry": {
              "coordinates": [[[-115.43197,32.924028],
              [-115.42354,32.923947],
              [-115.423616,32.93051],
              [-115.431959,32.930542],
              [-115.43197,32.924028]]],
              "type": "Polygon"
          },
          "start_time": "2018-03-01T00:00:00Z",
          "end_time": "2022-11-01T00:00:00Z",
          "rrule": "FREQ=MONTHLY;BYMONTH=3,4,5,6,7,8,9,10",
          "item_types": ["PSScene"],
          "asset_types": ["ortho_analytic_8b"]
          }
          },
            "delivery": { ... }
        }
|
|
For the above order, the TOI spans from our start date, March 1, 2018, until our end date, November 1, 2022. If you are not interested in monitoring during off-season months, you can use Recurrence Rules (rrule) to filter for data from certain months. In the above example, we set a rule to send data only during the months between March (3) and October (10). This reduces the volume of data by not sending off-season data to your cloud.
The TOI is set to include data from previous growing seasons to use as a baseline for analysis of this growing season. For example, you could use the historical data to identify areas of persistent under-performance within a field. Or, you can use this data for time series analysis, identifying dates when events like tilling, planting, or harvesting occurred. As part of Planet’s Area Under Management (AUM) offering, you have access to Planet’s archive for the areas that you choose to monitor at no additional cost.
When you place an order for a timeframe which includes dates that have already passed, the order is “backfilled.” In other words, historical imagery from Planet’s archive for your TOI is sent to your cloud storage at the time of order. If your TOI extends into the future, imagery is delivered to your cloud storage as it is added to Planet’s catalog in what we call “forward fill.”
Raster processing with Subscriptions API tools
Remote sensing data requires a significant amount of processing to be turned into a usable form. Planet handles much of the preprocessing, including radiometric calibration, orthorectification, and more. To further help with preprocessing, the Subscriptions API supports a collection of tools that can prepare your data prior to cloud delivery. Below is a list of currently supported tools:
| Tool | Description |
|---|---|
| Harmonize | Harmonize PlanetScope imagery with Sentinel-2. |
| Top of Atmosphere Reflectance (TOAR) | Convert Analytic assets from radiance to reflectance. |
| Clip | Clips imagery assets to your area of interest. |
| Reproject | Reproject, resample, and rescale imagery products to a new projected coordinate system and resolution. |
| Band Math | Apply mathematical expressions using the spectral bands of Planet imagery to produce outputs and indices. |
These tools help to leverage PlanetScope data for visualization and analysis. For example, in agricultural field monitoring applications, the Clip tool is critical for reducing the size of the data because the area of a field is likely much smaller than the area of a PlanetScope scene. The Clip tool clips the rasters that are delivered to the extent of your AOI, as defined in your parameters when you create a Subscription. By clipping the data, you can reduce your cloud storage costs, analyze data faster, and visualize data in mapping applications more efficiently and effectively.
The Harmonize tool adjusts the Surface Reflectance measurements from PlanetScope instruments to align them with Sentinel-2. The tool is helpful when performing analysis across multiple PlanetScope sensor types from archive data because it minimizes scene-to-scene and sensor-to-sensor variability. This tool is especially useful when working with Dove Classic data as newer Doves, including SuperDoves, are already closely aligned with Sentinel-2. However, this tool has caveats and should be tested in your area of interest as it may not work as well in areas of rapid change (agricultural fields) or when scenes include bodies of water. For more information, please read: Scene Level Normalization and Harmonization of Planet Dove Imagery.
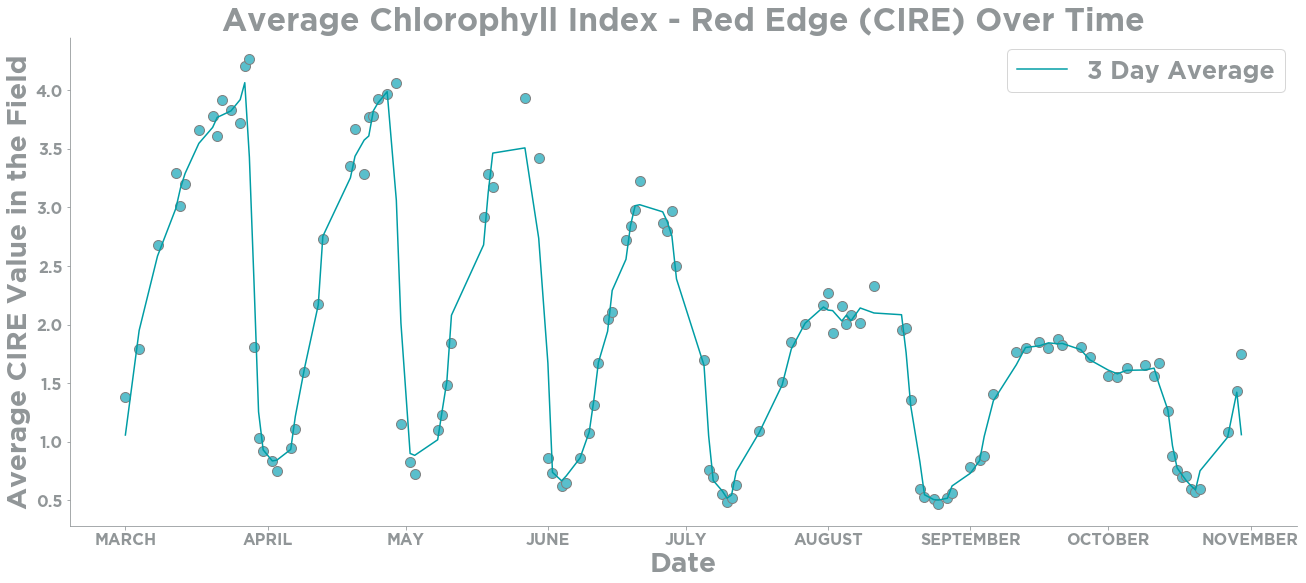
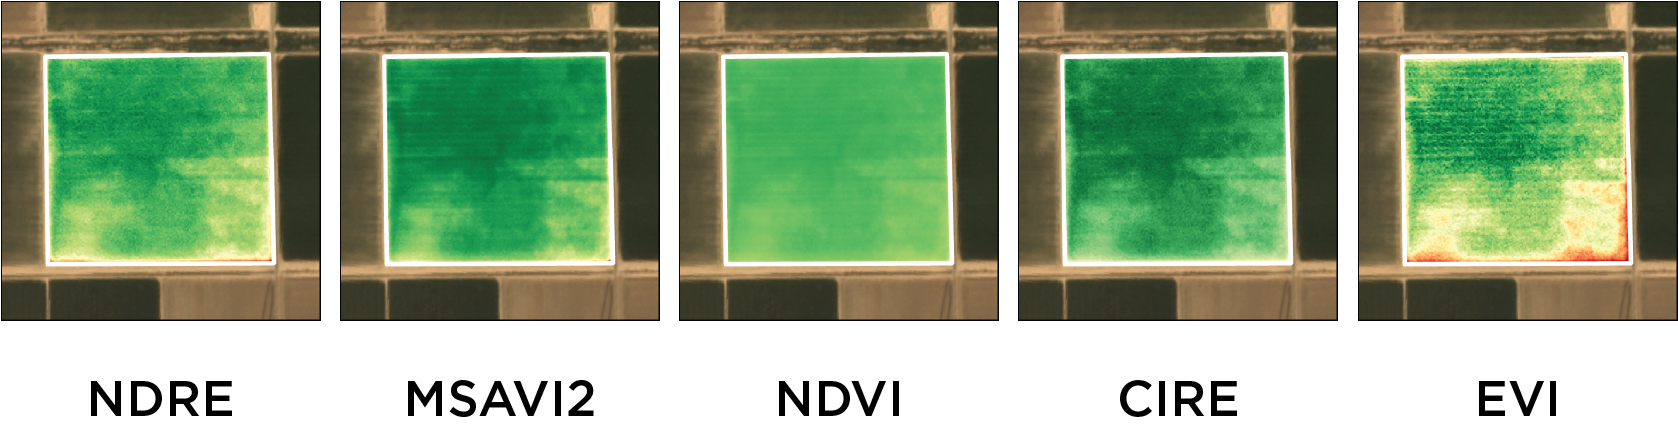
Another very useful tool for agriculture is Band Math. PlanetScope imagery captured by the SuperDove fleet includes 8 spectral bands which can be used for true color and false color visualizations. The Band Math tool in the Subscriptions API enables you to perform calculations using the different spectral bands and store the resulting values in a new raster. These 8 spectral bands can also be used to create indices such as:
| Acronym | Index Name | Formula |
|---|---|---|
| NDVI | Normalized Difference Vegetation Index | ( NIR - R ) / ( NIR + R ) |
| NDRE | Normalized Difference Red Edge | ( NIR - RedEdge ) / ( NIR + RedEdge ) |
| CIRE | Chlorophyll Index Red Edge | ( ( NIR / RedEdge ) - 1 ) |
| MSAVI2 | Modified Soil-adjusted Vegetation Index 2 | ( 2 * NIR + 1 - sqrt ( ( 2 * NIR + 1 ) ^ 2 - 8 * ( NIR - RED ) ) ) / 2 |
| EVI | Enhanced Vegetation Index | 2.5 * ( NIR - RED ) / ( NIR + 6 * R - 7.5 * B + 1 ) |
Band Math creates an additional imagery output file which supports up to 15 bands with different calculations. Computation for calculating indices is completed before the imagery arrives in your cloud storage, reducing the time and steps you need to take to build your final solution.
Cloud Delivery & Format
Now that we have created a Subscription for our AOI & TOI, and we have defined our processing tools, we are ready to deliver the data. When you create a Subscription you need to define your cloud storage destination from one of the supported delivery options. Using the File Format tool, you can also specify the file format for the rasters that are delivered as Cloud Optimized GeoTiffs (COGs). COGs are a Cloud Native Geospatial data format which is an efficient file format for on-the-fly processing and geospatial visualization. They enable any tool or client to request portions of the file based on the area of interest.
By utilizing the Subscriptions API, you are able to set up a regular delivery of satellite imagery to your cloud storage on a near-daily basis. The imagery can be filtered to fit your criteria and processed to your specifications prior to delivery. The Subscriptions API can reduce the cost and effort needed to prepare your data to be ready for visualization and analysis, ultimately reducing the time it takes for data to reach its end-users for decision making.

Next steps…
The Subscriptions API can be a powerful tool for use-cases where you need historical data and/or ongoing monitoring, making it highly valuable for agriculture monitoring. You can find documentation for the Subscriptions API in the Developer Center and sample notebooks for using the Subscriptions API in our GitHub repo. Also subscribe to our Developer Newsletter and get more information like this!