Eroding Coastlines: A GeoSpatial and Computer Vision Analysis
By: Kevin Lacaille, Mansi Shah on August 04 2022
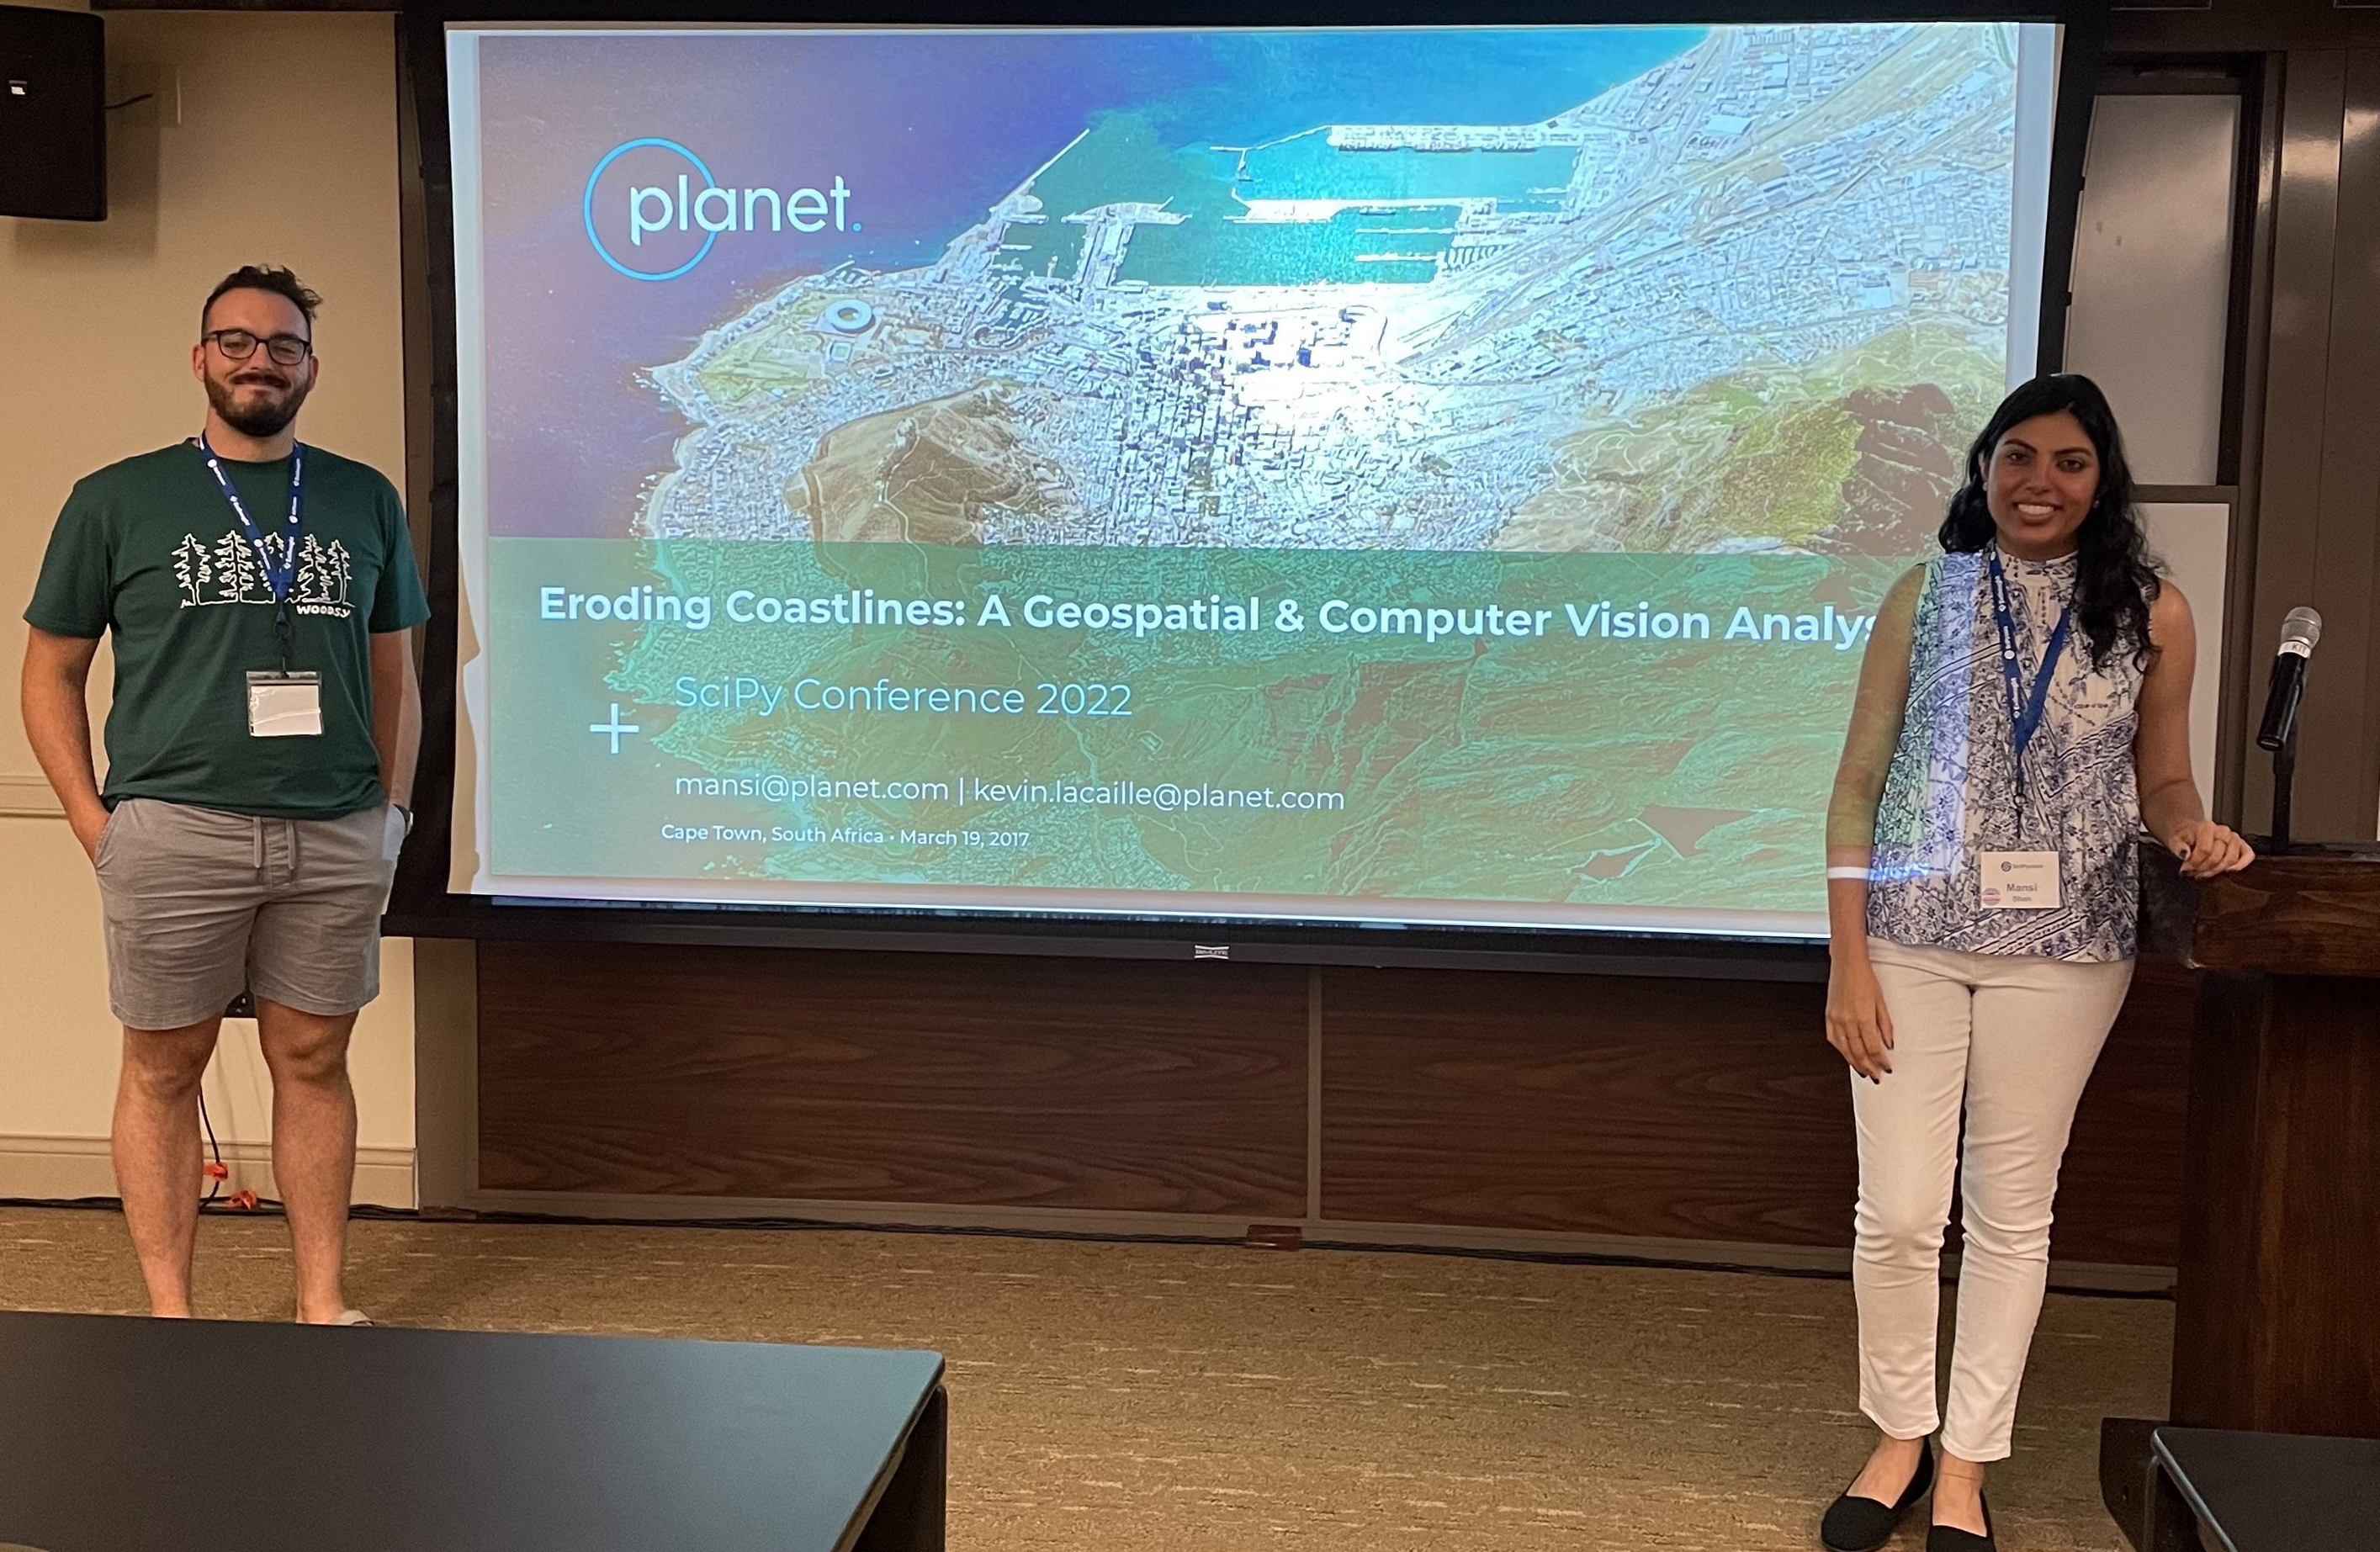
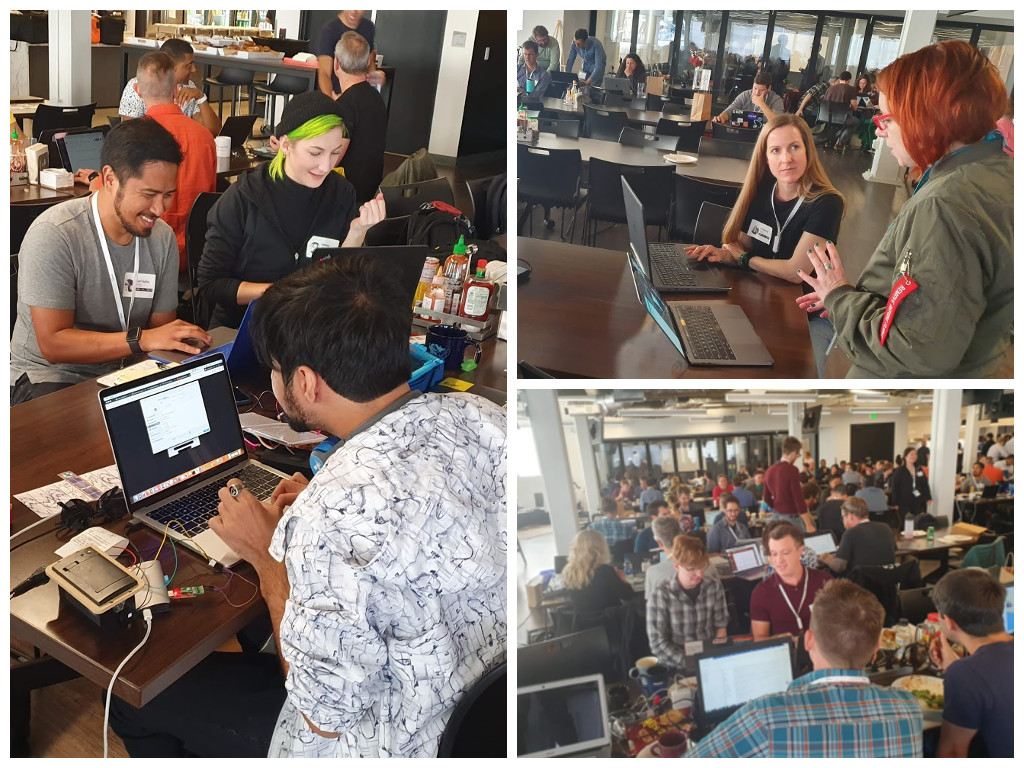
We are thrilled to announce that two of our very own DevRel software engineers, Mansi Shah and Kevin Lacaille, were selected to present a tutorial titled Eroding Coastlines: A GeoSpatial and Computer Vision Analysis at Scientific Python 2022 conference in Austin, TX.
According to their website, the annual SciPy Conference “brings together attendees from industry, academia, and government to showcase their latest projects, learn from skilled users and developers, and collaborate on code development.”
Participants of Mansi and Kevin’s workshop gained hands-on experience exploring some of Planet’s publicly-available satellite imagery using Python tools such as rasterio, numpy, matplotlib, scipy, and openCV, to analyze medium- and high-resolution imagery data. During the second half of the workshop, participants applied what they learned to identify and analyze instances of coastal erosion, one of the most pressing environmental and humanitarian challenges facing our planet today. The tutorial involved a combination of slides and hands-on, live coding with real-world publicly-available data in Jupyter notebooks – no previous experience with geospatial or computer vision Python libraries necessary.
Coastal Erosion – Why It Matters
Coastal erosion is defined as the loss or displacement of land on coastlines due to waves, currents, tide, wind, waterborne ice, storm impact, and other natural and unnatural forces. While the natural weathering of coastlines is normal, human-led activities such as coastal mining, infrastructure development, and construction can accentuate the issue. Let’s also not forget rising sea levels are a result of climate change. The IPCC states with high confidence that the Global Mean Sea Level (GMSL) has risen 3.6mm each year, on average, from 2006-2015. Risk related to sea level rise, including erosion along all low-lying coasts, is expected to significantly increase by the end of this century without major additional adaptation efforts. Long-term impacts of coastal erosion include loss of habitat quality, degradation of coral reefs, increased turbidity of water, reduced tolerance for communities in the face of natural disasters, and reduced sand volume. These environmental impacts are in addition to the millions of dollars lost and spent annually on coastal property loss, tourism collapse, and erosion control measures in the U.S. alone.
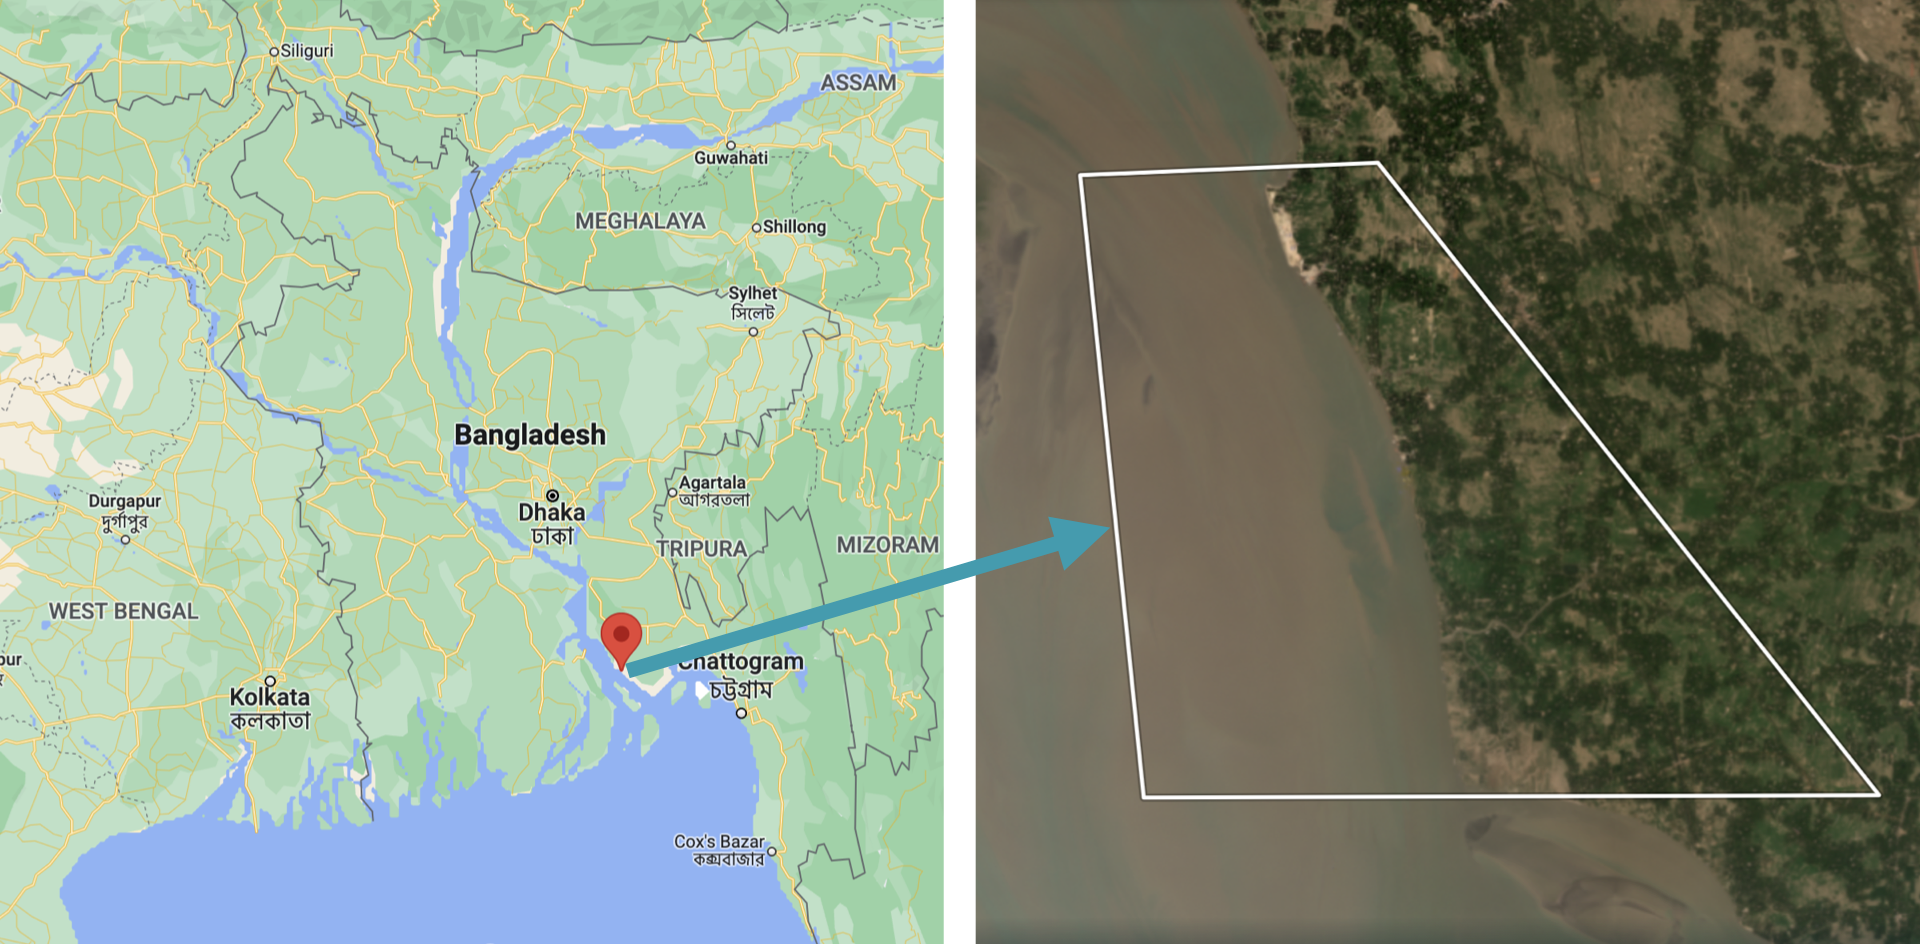
Inspired by Crawford et. al (2020), the case study for this tutorial analyzed a severe example of coastal erosion, centered on a small, 7 km (4 mi), coastal region in Kamalnagar, Bangladesh. This region is located in Southern Bangladesh, where the ocean (Bay of Bengal) meets a major inlet, the Meghna River. Coastal erosion in Bangladesh is a recurring problem, causing thousands of people to be displaced annually. In fact, coastal Bangladesh experiences erosion rates that are among the highest in the world.
The workshop began with some geospatial and computer vision techniques, then moved on to apply those techniques to detect and analyze coastal erosion. The workshop focused on:
- extracting data from multi-band imagery
- computing the normalized difference water index (NDWI)
- using the NDWI to identify regions of water and land within the area of interest (AOI)
- applying classical image processing and computer vision techniques to analyze coastal erosion
The folks attending the workshop created a data and image processing pipeline. Then they detected and measured the effects of coastal erosion in Kamalnagar, Bangladesh. They found that over the past 5 years the land had receded about 2 km (1.2 mi) and that the region had lost about 11 km2 (2742 acres) of landmass. On average, this translates to the region losing about 400m (1300 ft) of coastline and about 2.2 km2 (550 acres) of landmass, each year. In addition to identifying coastal recession, our analysis showed that the recession was speeding up year-over-year, consistent with what the authors of Crawford et. al (2020) had found.
The workshop demonstrated that not only can geospatial data be beautiful, but it can also be used for great scientific purposes. In this case, it can be used to identify areas critically affected by natural disasters, which are prime candidates for humanitarian aid.
Planet & Environment
Our planet is important to us. One of Planet’s ethical principles is to protect the environment: “we actively develop and support uses of our data, products and services that address the critical planetary crises of our time, from climate change to the loss of nature.” This carries into our work in Developer Relations. We reflect this deep care for the environment in our work. Whether our tutorial attendees are environmental scientists, geospatial experts, or completely new to the field, a key part of our role on team DevRel is to engage and empower developers. At Planet, we enable technical users to do amazing and intentional things with our data. We’re here to support the search for answers.
Next Steps
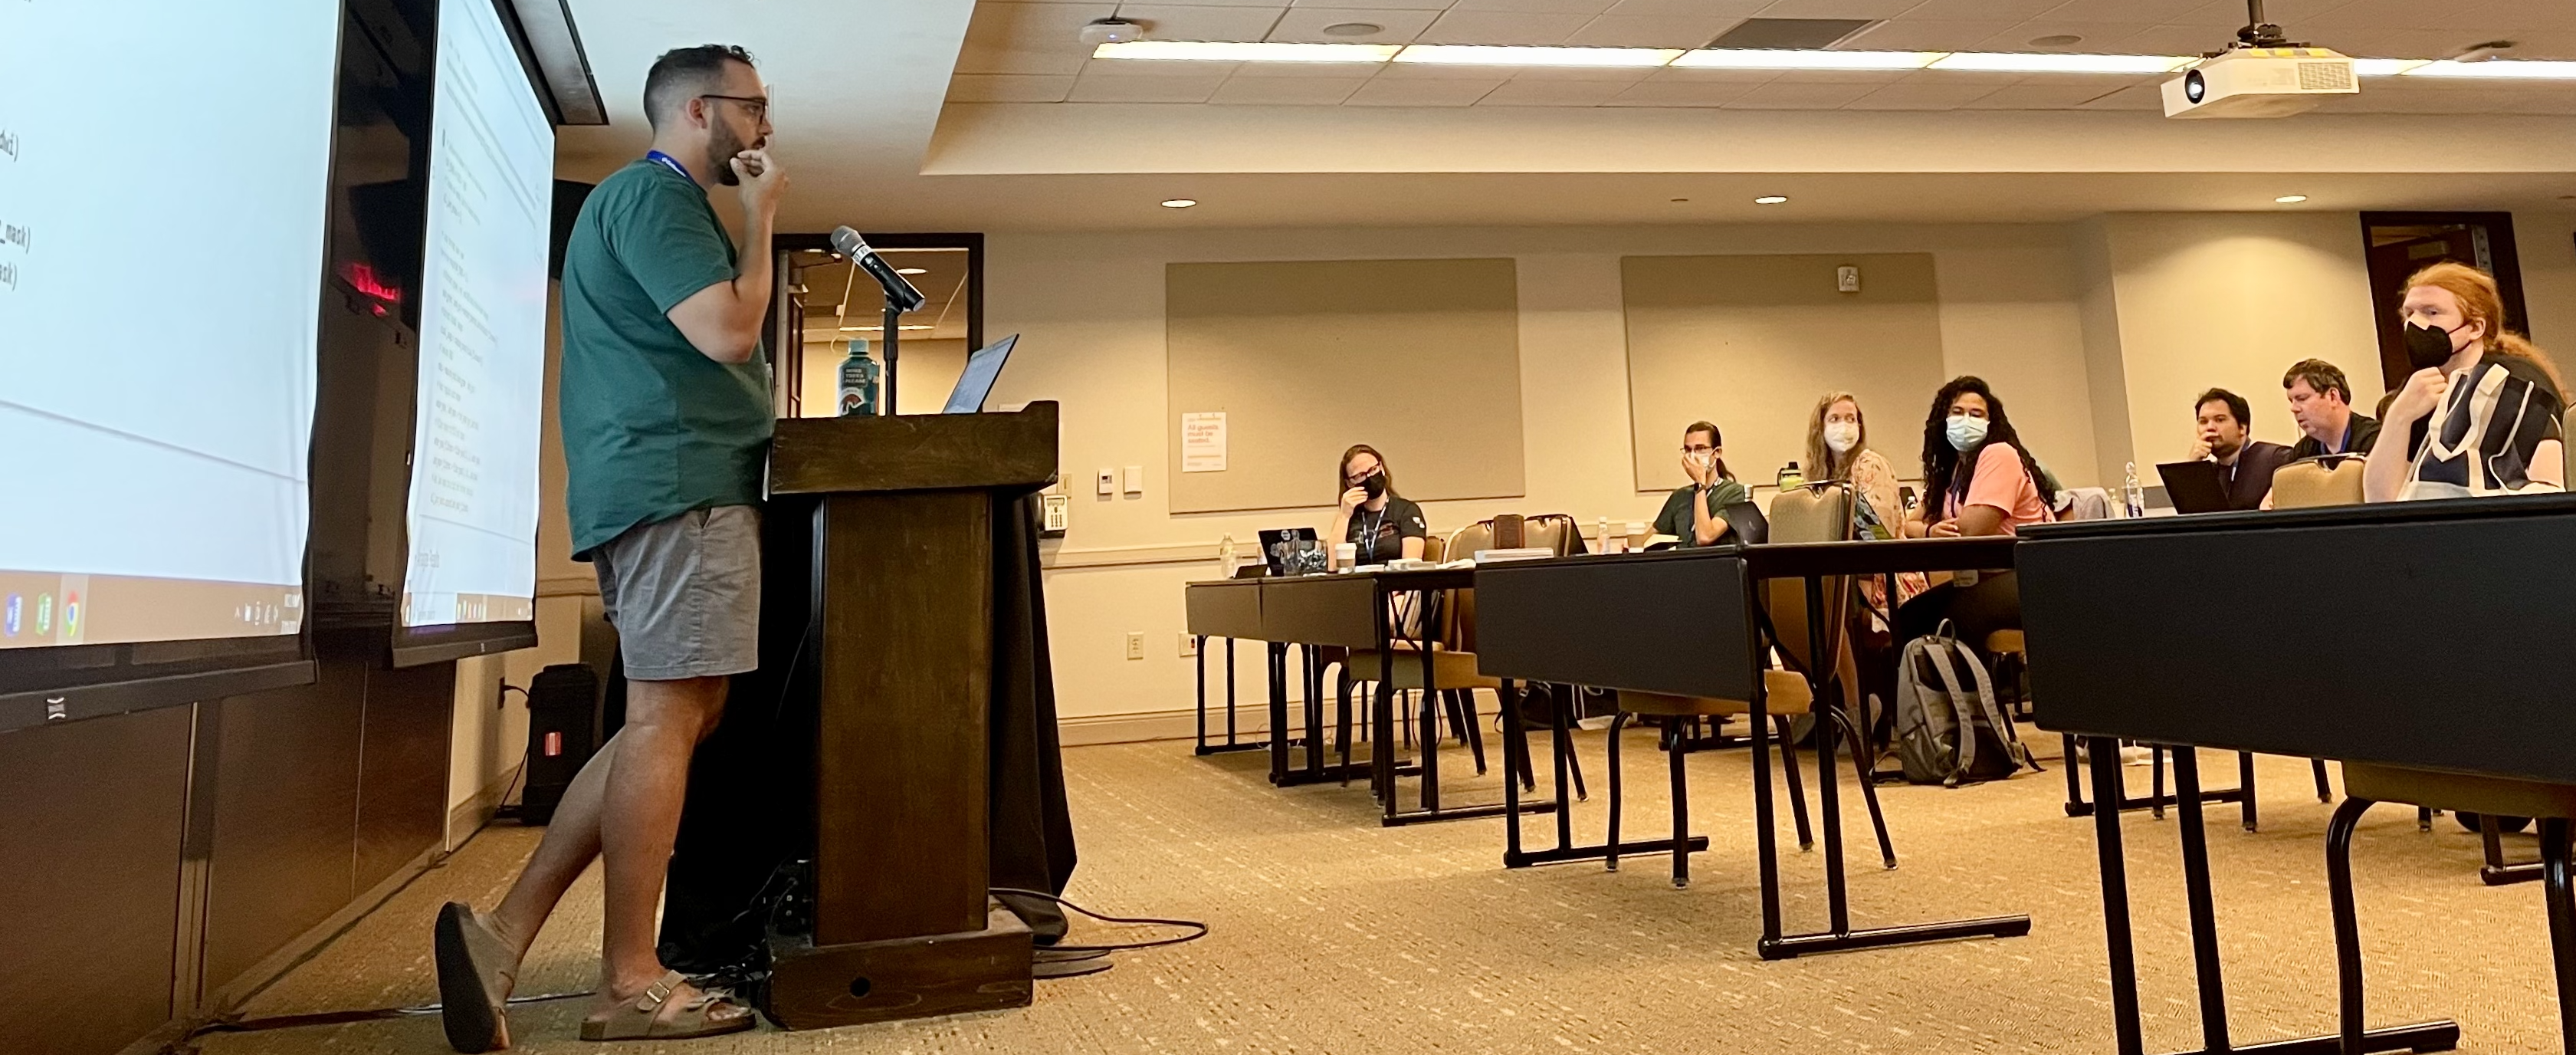
Kevin and Mansi were excited to engage with users of Planet’s data and the broader Python developer community around technical topics and environmental issues that matter. This was Planet Developer Relations’ first in-person presence at such a conference since 2020. We’re looking forward to reconnecting with old connections and building new ones. And we hope to see you there! Mansi Shah and Kevin Lacaille presented their tutorial at the SciPy 2022 conference in Austin, TX on July 11, 2022 from 8:00am-12:00pm CDT. Watch their presentation on YouTube. Try your hand at the Coastal Erosion Jupyter Notebook.
Planet and Cloud-Native Geospatial
By: Chris Holmes on May 26 2022
Planet and cloud-native geospatial open source
After Sara’s announcement of our new blog, I have the honor of writing the second substantive post on this blog. I’ve been at Planet for a long time and have always felt developers are our most important users. So I’m pleased to share that just recently I shifted my role to become the Product Manager of the Developer Relations team that Sara leads. Most exciting for me is that we’ve expanded the scope of the team to include what we call “Open Initiatives,” one of which is “Cloud-Native Geospatial,” encompassing all the work I’ve been doing on things like SpatioTemporal Asset Catalogs (STAC) and Cloud-Optimized GeoTIFFs (COG), plus new topics like GeoParquet.
A lot of my time recently went into organizing the Cloud-Native Geospatial Outreach Event that happened last month. Planet was a top sponsor, and a number of Planeteers gave talks. It’s super cool to watch the videos of the talks and to see how the community just continues to explode. With over 1600 registrations, I think we’ll see another jump in momentum after the event. I wanted to share a bit about Planet’s pioneering role in Cloud-Native Geospatial, as well as what we’re working on next and why we’re excited about this great ecosystem.
Planet and the genesis of Cloud-Native Geospatial
Planet was lucky to be among the first “cloud-native” satellite imagery providers (perhaps even the first). It was really a matter of timing, as Planet was founded right when any sensible Silicon Valley startup trying to achieve scale moved to the cloud. At that time, a standard image processing pipeline would involve image processing experts using desktop software to produce the imagery for customers. But Planet had huge aspirations of scale, with the mission to “image the whole earth every day” at the center of what everyone did. The amount of data coming in from Planet’s planned constellation meant that everything needed to be automated. So Planet just built its data pipeline and data hosting platform out right, and became a big supporter of the “cloud-native geospatial” movement before it even had a name.
The movement clearly started with the advent of the Cloud-Optimized GeoTIFF, which Planet played a key role in creating. The idea behind COG was discussed and built out in the AWS Landsat Public Dataset project, with Planet as a key contributor. Then it came together as a standard in a meeting I remember at Planet headquarters. We had a whiteboard session with Frank Warmerdam of GDAL fame, Matt Hancher who co-founded Google Earth Engine, and Rob Emanuele who led RasterFoundry at Azavea and now leads engineering on Microsoft Planetary Computer. We wanted a format that Planet could produce and that would be streamable into these two new cloud-native geospatial compute engines. And one that is ideally backwards compatible with a standard GeoTIFF, so it would still work for local workflows. Planet then funded Even Rouault to create the original specification and document the GDAL drivers.
Planet also worked on the evolution of SpatioTemporal Asset Catalogs (STAC), which started when Radiant Earth convened a diverse group of geospatial experts and organizations in Boulder, CO to collaborate on the interoperability of data catalogs. I recently posted on the history of Planet’s support of STAC. Planet’s role in STAC is one of the things I’m most proud of, and it’s fun to see it integrating into Planet’s API’s.
Why we support Cloud-Native Geospatial
Planet supports cloud-native geospatial because our imagery must be much more accessible to have the impact we aspire for. I’d like to explain a bit more as to why we support this ecosystem.
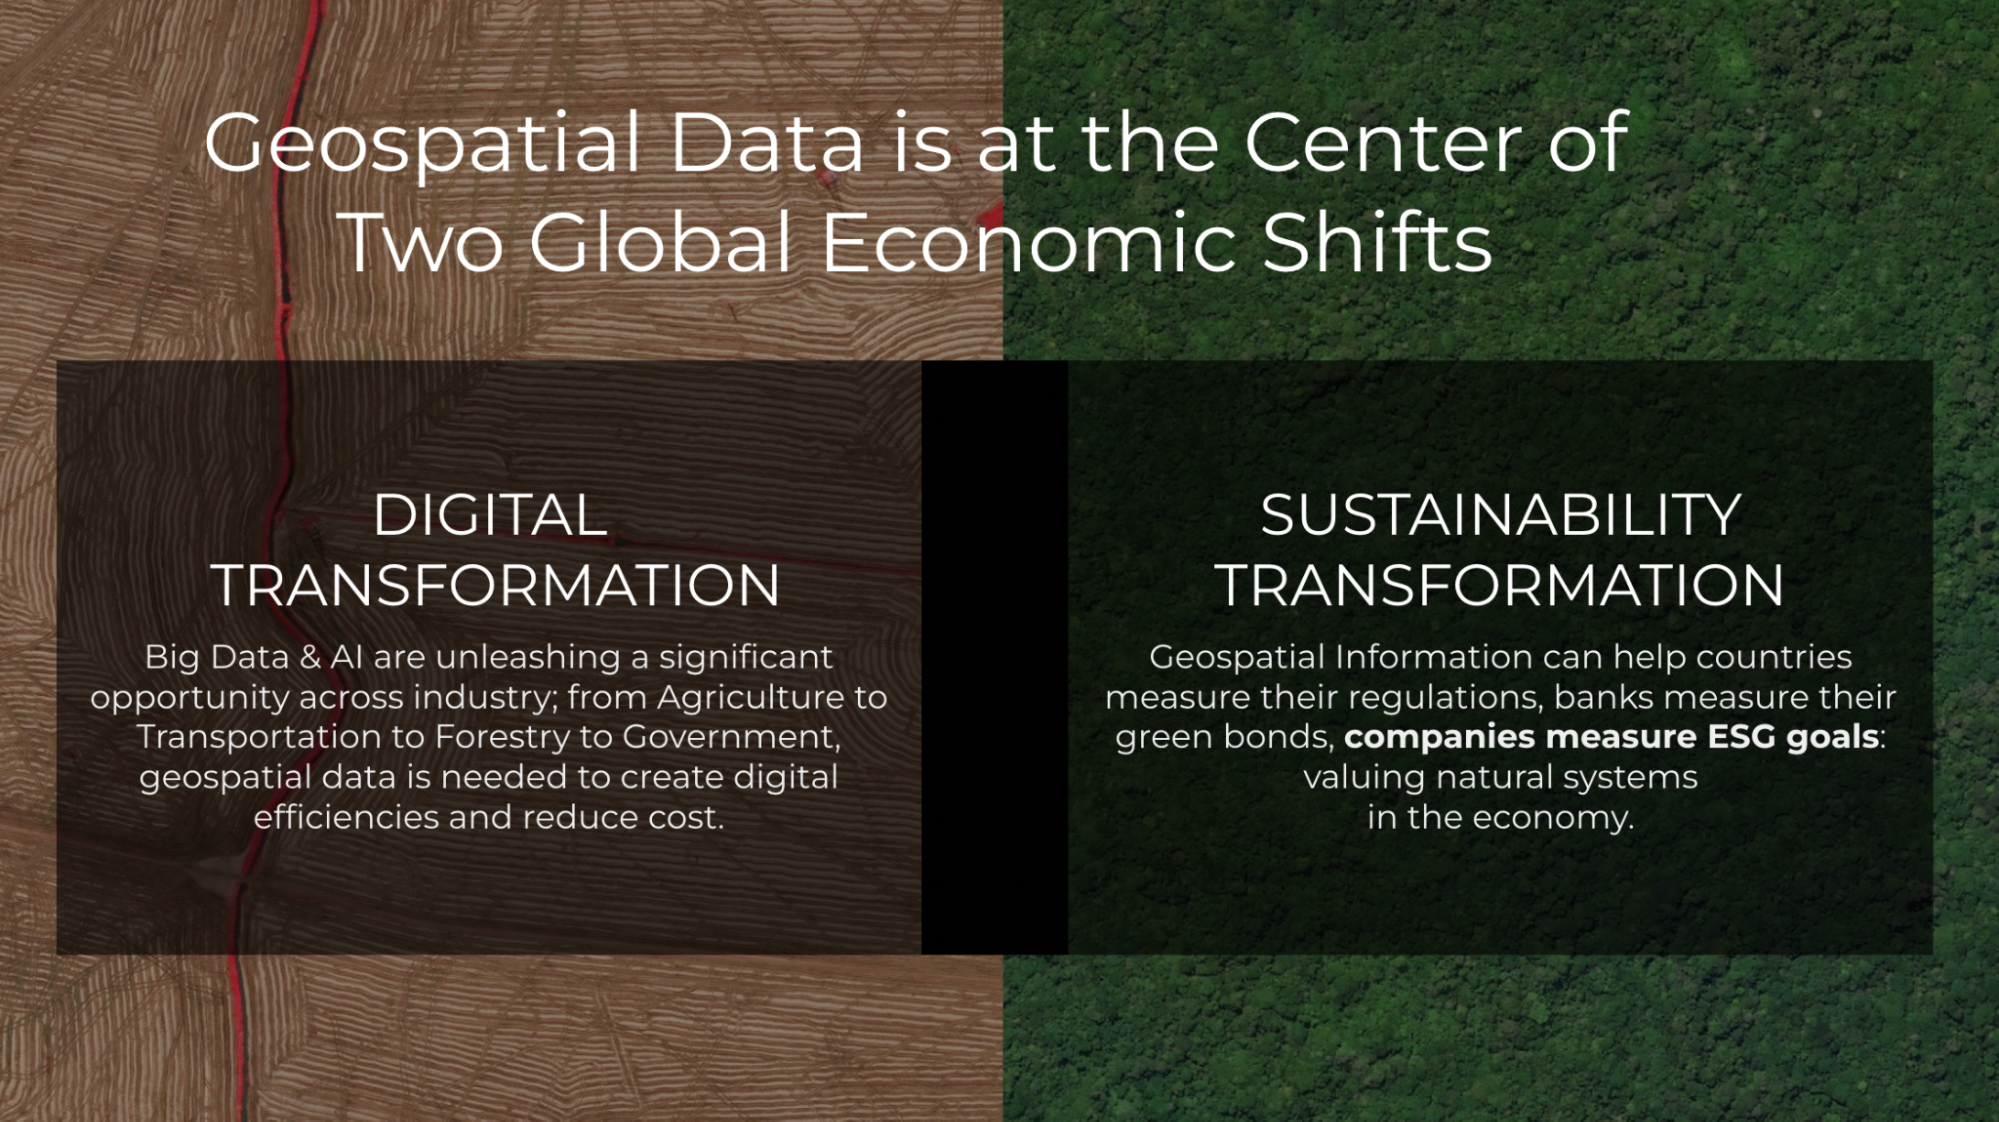
There are two critical economic shifts transforming the world:
- The Digital Transformation, where organizations are using Big Data and Artificial Intelligence to understand what they do and to do it more efficiently
- The Sustainability Transformation, where data about our planet is key to valuing natural systems in the economy
Geospatial Information is useful for many organizations found in either or both of these movements. But the benefit will not be realized if everyone must become experts in remote sensing and GIS. It is incumbent upon us to make information about the earth accessible and integrated into the workflows people use everyday. And the biggest challenges always need more data sources, combined in insightful ways. Planet’s APIs and data formats need to be in the formats, tools, and channels used to create solutions that make a difference.
Cloud-native geospatial has the potential to make geospatial data far more accessible within existing workflows and architectures. By doing so, users don’t need to be experts in remote sensing and GIS. They just need to understand how to work with data.
Making Planet’s data more accessible to developers
Planet is working hard to ensure the developer experience is as solid as possible. The headline news of 8-band data availability is certainly cool, but what I’ve personally found especially impressive is how the team has greatly improved the quality of the imagery and reduced the complexity to access it. Improvements in our data pipeline include better alignment between pixels, a reduction in the number of artifacts, and a sharpening of the visual quality. And the new PSScene product simplifies and future-proofs how users and developers access imagery. Not quite as new, but seeing substantial adoption, is the Subscriptions API, which greatly simplifies the development time to integrate any monitoring workflow with Planet. Another great feature is the new harmonization tool, one of the key operations for Planet’s delivery tools in providing full Analysis Ready Data in an On-Demand workflow. Together these improvements are a huge step towards data that “just works,” enabling developers to order a atmospherically-corrected, pixel- and sensor-aligned stack of imagery for time series analysis without having to even think about all the complexities of remote sensing.
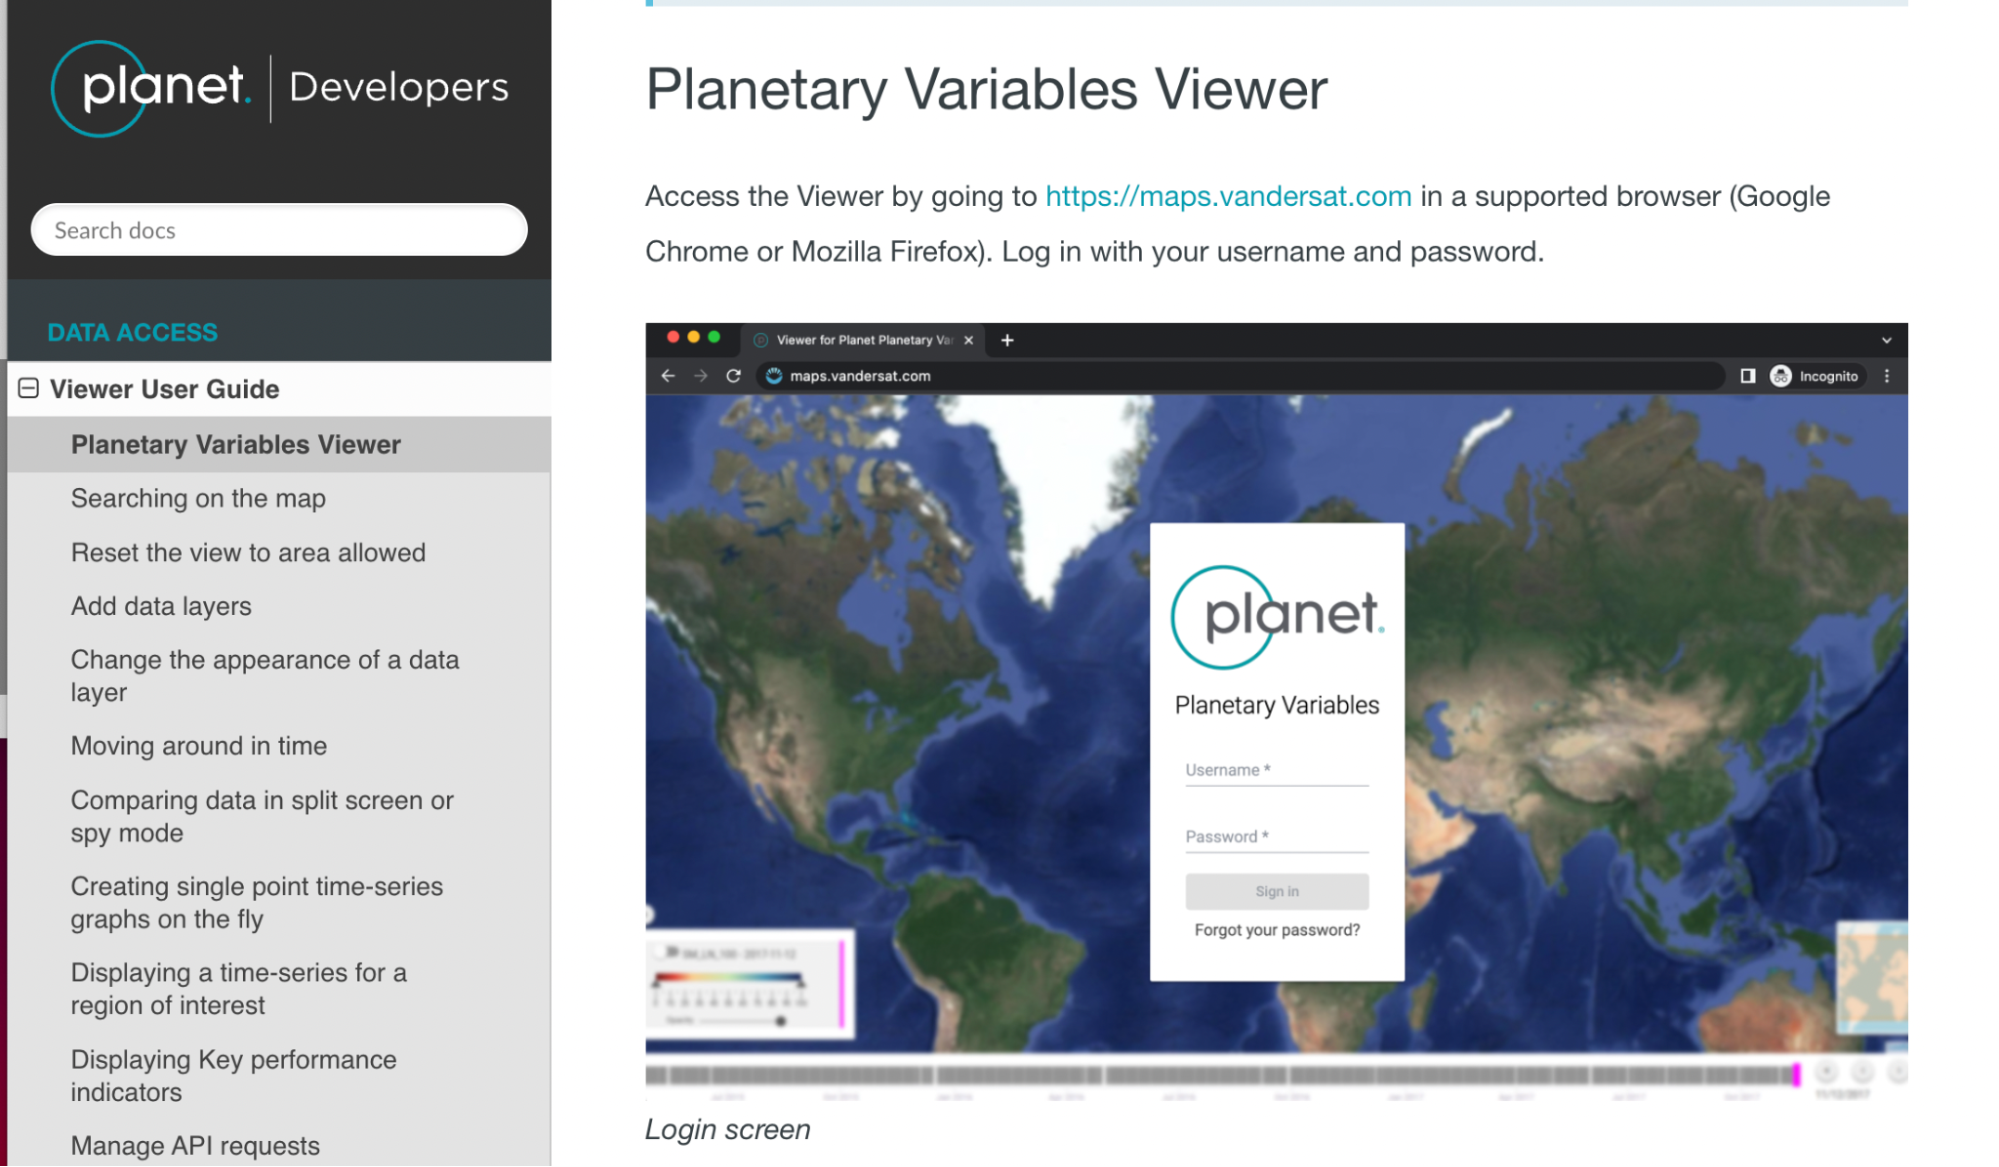
The next frontier in making Planet even more accessible to developers is the higher level data products that directly extract insights from satellite imagery. For example, Planet offers our Road and Building Change Analytics and what we call “Planetary Variables”, including Soil Water Content, Land Surface Temperature, and a proxy for Vegetation Biomass. These Planetary Variables go beyond just Planet’s imagery, fusing several different data sources, and will open up new use cases. Planet moving further up the stack, and into the “vector” area of geospatial, means much more access for new developers. And there are some interesting interoperability opportunities that we hope to contribute to.
What’s next for Planet and Cloud-Native Geospatial?
Planet data generates far more insight when it can be combined with other data. So we believe in helping create an ecosystem of tools and data that have interoperability at their core. One route is supporting tools like GDAL and Rasterio, which translate between any format. Another route is work toward the interoperability of the next generation of workflows, as COG and STAC do.
Building our team
Planet has recently been increasing its resources working on developer relations and cloud-native geospatial, including bringing on folks to work full-time on “open initiatives.”
- Sean Gillies joined the developer relations team a few months ago. Planet is supporting his time on Rasterio, Shapely, and Fiona—some of the most important geospatial tools in the Python ecosystem. The other project he’s helping out on is a new version of Planet’s Python client and command-line library, which you’ll hear about soon on this blog.
- Tim Schaub is one of the best developers I’ve worked with. You may know him as a leader of the open source OpenLayers JavaScript toolkit that Planet uses extensively. Tim has been going deep on Go, helping build Planet’s multi-source ARD product called “Fusion Monitoring.”
The developers relations team has also had a number of other great new hires, who you’ll hear from on this blog.
COG and STAC
In order for cloud-native geospatial to reach its full potential, COG and STAC will have to “cross the chasm” to mainstream adoption. To do so, we want to help everyone get a sense of just how much data there is in STAC and COG. If we can’t measure how much data is available in these new formats then we won’t be able to actually track progress and determine which of the various initiatives are working. To start, we’re focused on a crawler pointed at STAC Catalogs that reports back stats on the number of STAC Items, STAC Extensions used, and what format (COG, JP2K, Zarr, etc.) the assets are stored in. This, in turn, will help inform a new STAC extension making reporting easier, so we’re not having to hand crawl tens of millions of STAC records. We hope to report on the overall STAC and COG data holdings that anyone can access. We’ll work to integrate with STACIndex.org, which is where this idea originally came from.
To support this, Tim has revived the Planet go-stac open source library, getting it up to speed with STAC 1.0.0, and improving its crawling and validation capabilities. It’s now capable of very fast recursive crawling, with more improvements coming soon.
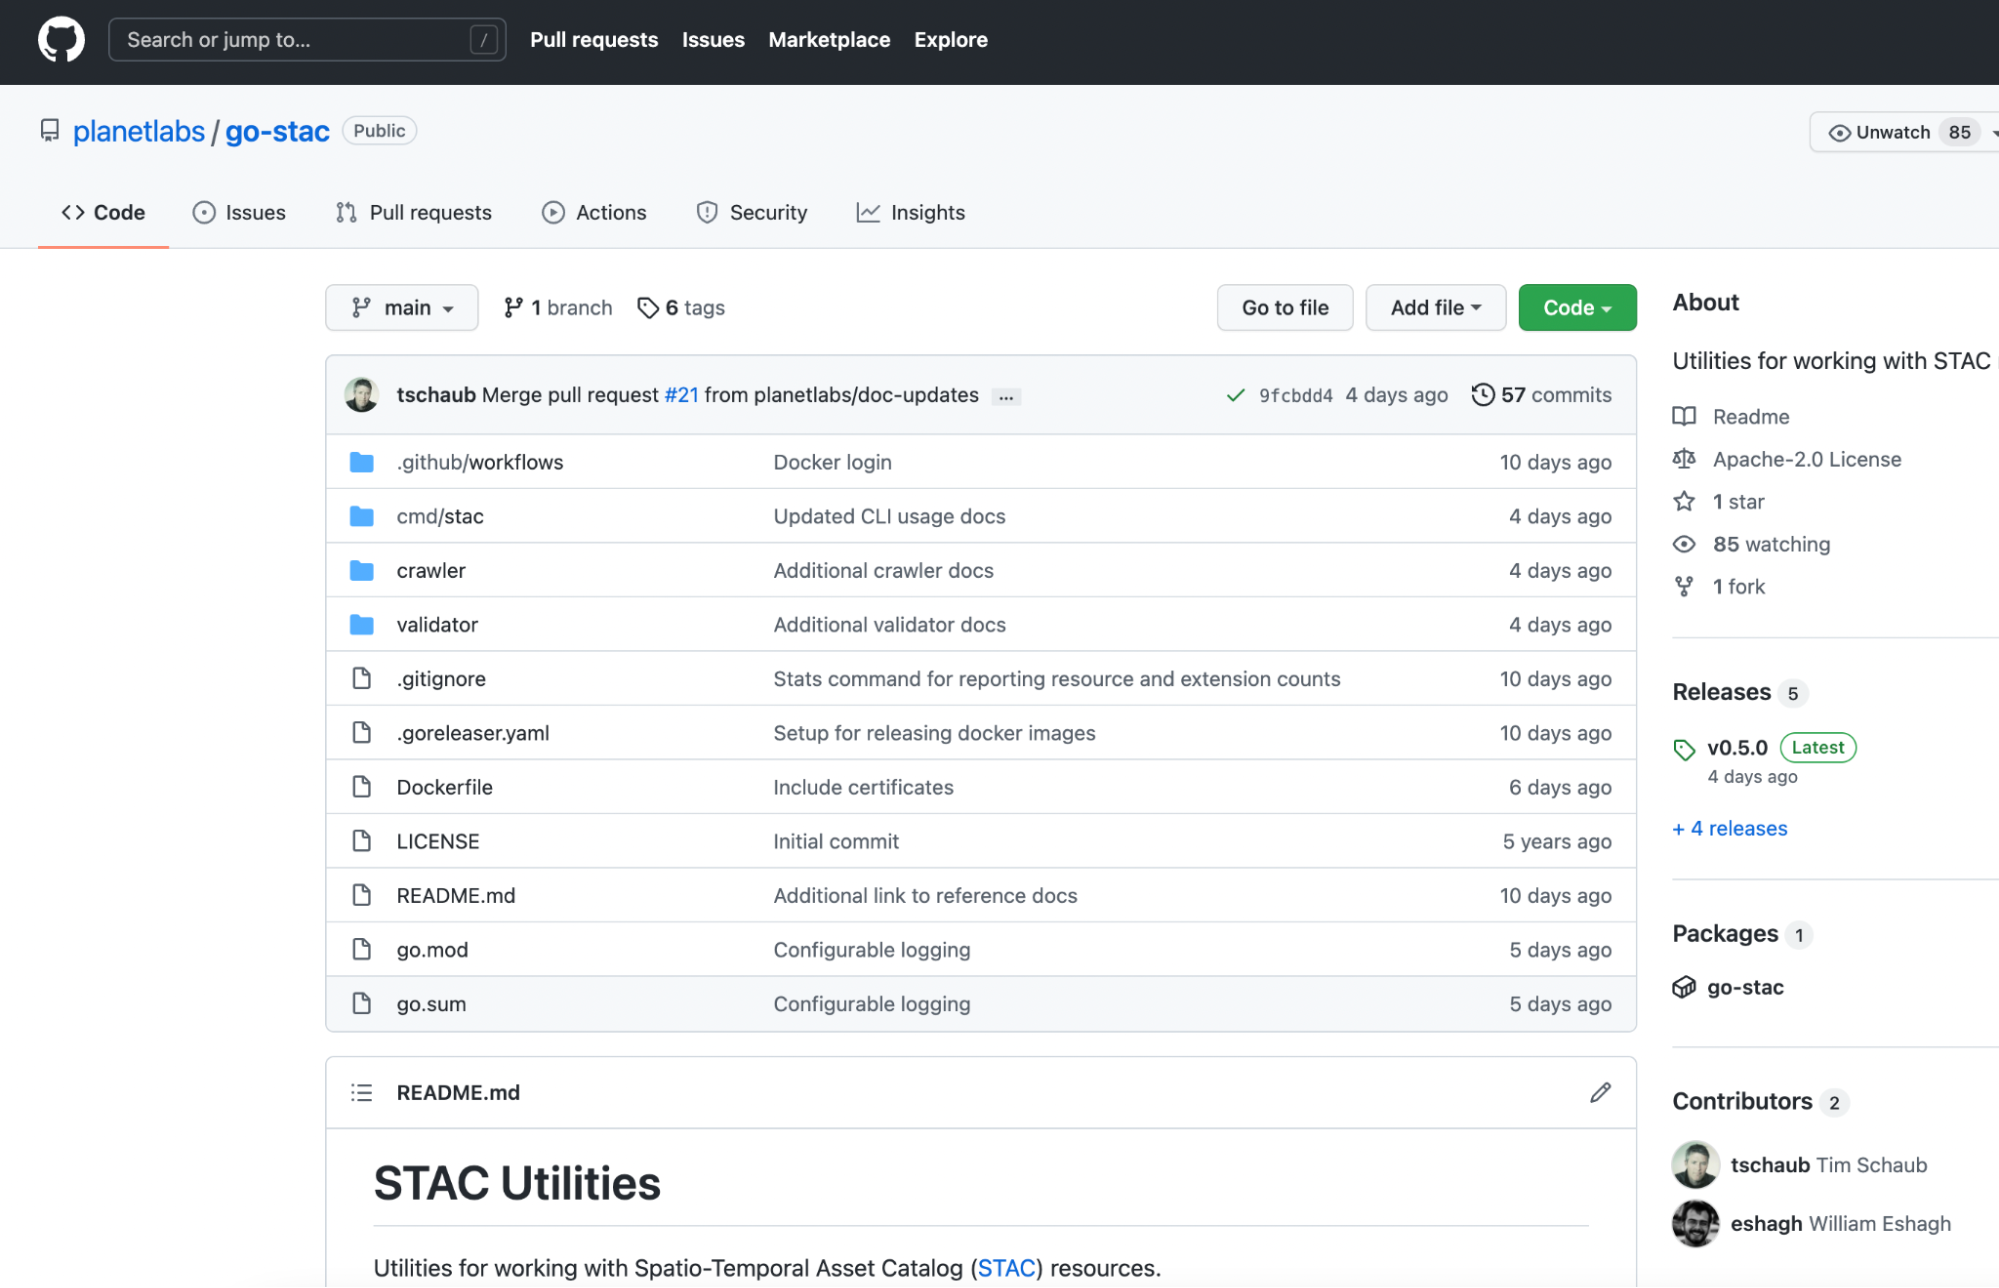
We are also starting to use the library internally to build and deploy Planet’s STAC Catalog of open data.
Cloud-Native Vector
Another area where we’ll be focused is the standards that can make our higher-level “Planetary Variables” data more interoperable. The goal is to have these available in “vector” data formats—the points, lines, and polygons that can be represented as rows in a database. Indeed, one end goal would be delivering daily information as simple tabular values against known geometries. This would mean a user already has the geometry of a state, county or even a field and they’d just get a daily update—say, of the plant biomass or soil moisture reading for the day.
Cloud data warehouses like BigQuery, Snowflake, and Redshift are driving a revolution in how organizations handle all of their data, and all have native geospatial support. So there is an opportunity to fit Planet’s daily variables about our earth directly into the workflows being used today. This has led us to helping seed efforts like GeoParquet. Javier de la Torre, from Carto, wrote a great overview introducing GeoParquet. Planet is working to build the community and the specification, and we funded the development of the GDAL/OGR reader that is included in GDAL 3.5.0. An interoperable format would enable us to publish data once and stream to a variety of cloud tools.
Next step: Join us
We’ve gotten this far by collaborating with others, and I think the opportunity to make geospatial more accessible is limitless. We hope others will join us in open collaboration. If you’d like to continue to get updates on what we’re up to in cloud-native geospatial, as well as all kinds of content about our API’s, tools, and the geo technical developer community in general, please follow our blog. And do check out our contributions to the Cloud-Native Geospatial Outreach Event, see the playlist on youtube for all the content.
Forward-looking Statements
Except for the historical information contained herein, the matters set forth in this blog are forward-looking statements within the meaning of the "safe harbor" provisions of the Private Securities Litigation Reform Act of 1995, including, but not limited to, the Company’s ability to capture market opportunity and realize any of the potential benefits from current or future product enhancements, new products, or strategic partnerships and customer collaborations. Forward-looking statements are based on the Company’s management’s beliefs, as well as assumptions made by, and information currently available to them. Because such statements are based on expectations as to future events and results and are not statements of fact, actual results may differ materially from those projected. Factors which may cause actual results to differ materially from current expectations include, but are not limited to the risk factors and other disclosures about the Company and its business included in the Company's periodic reports, proxy statements, and other disclosure materials filed from time to time with the Securities and Exchange Commission (SEC) which are available online at www.sec.gov, and on the Company's website at www.planet.com. All forward-looking statements reflect the Company’s beliefs and assumptions only as of the date such statements are made. The Company undertakes no obligation to update forward-looking statements to reflect future events or circumstances.
Subscriptions API for Daily Agriculture Monitoring
By: Matt Ballard on May 12 2022
Use the Subscriptions API for scouting, performance, precision applications, and more.
The Subscriptions API
At Planet, our satellites capture near-daily imagery of Earth’s entire landmass. You can use this data to build monitoring solutions for everything from directed field scouting to field performance monitoring to precision applications and more. The historical archive data that Planet has collected can be used to gather historical context, train models, and perform time-series analysis. For these persistent, always-on monitoring solutions, we provide the Subscriptions API to make it easier for you to integrate Planet data into your solutions.
With a single API call, the Subscriptions API allows you to subscribe to a continuous delivery of imagery to the cloud of your choice. You can set it up so you only receive data you’re interested in by making use of filters for your area of interest (AOI), time of interest (TOI), and more. As new imagery is added to our catalog, the Subscriptions API automatically checks to see if it meets your criteria. If it does, imagery is sent directly to your cloud storage destination. This significantly reduces the complexity of building a monitoring solution. You don’t need to build your own infrastructure or application for polling an API to search for newly available data.
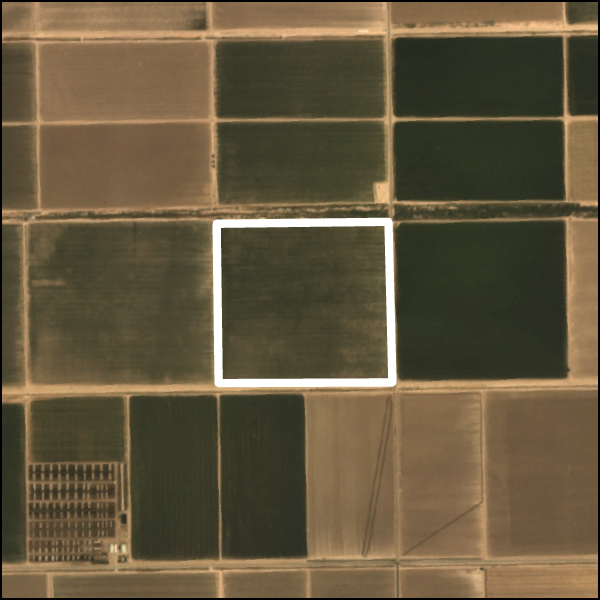
Let’s take, for example, a solution for monitoring the health and performance of an agricultural field. Below is a sample API request over our field AOI for the 2018-2022 growing seasons:
        POST https://api.planet.com/subscriptions/v1/
        {
          "name": "Agriculture Field 12345",
          "source": {
          "type": "catalog",
          "parameters": {
          "geometry": {
              "coordinates": [[[-115.43197,32.924028],
              [-115.42354,32.923947],
              [-115.423616,32.93051],
              [-115.431959,32.930542],
              [-115.43197,32.924028]]],
              "type": "Polygon"
          },
          "start_time": "2018-03-01T00:00:00Z",
          "end_time": "2022-11-01T00:00:00Z",
          "rrule": "FREQ=MONTHLY;BYMONTH=3,4,5,6,7,8,9,10",
          "item_types": ["PSScene"],
          "asset_types": ["ortho_analytic_8b"]
          }
          },
            "delivery": { ... }
        }
|
|
For the above order, the TOI spans from our start date, March 1, 2018, until our end date, November 1, 2022. If you are not interested in monitoring during off-season months, you can use Recurrence Rules (rrule) to filter for data from certain months. In the above example, we set a rule to send data only during the months between March (3) and October (10). This reduces the volume of data by not sending off-season data to your cloud.
The TOI is set to include data from previous growing seasons to use as a baseline for analysis of this growing season. For example, you could use the historical data to identify areas of persistent under-performance within a field. Or, you can use this data for time series analysis, identifying dates when events like tilling, planting, or harvesting occurred. As part of Planet’s Area Under Management (AUM) offering, you have access to Planet’s archive for the areas that you choose to monitor at no additional cost.
When you place an order for a timeframe which includes dates that have already passed, the order is “backfilled.” In other words, historical imagery from Planet’s archive for your TOI is sent to your cloud storage at the time of order. If your TOI extends into the future, imagery is delivered to your cloud storage as it is added to Planet’s catalog in what we call “forward fill.”
Raster processing with Subscriptions API tools
Remote sensing data requires a significant amount of processing to be turned into a usable form. Planet handles much of the preprocessing, including radiometric calibration, orthorectification, and more. To further help with preprocessing, the Subscriptions API supports a collection of tools that can prepare your data prior to cloud delivery. Below is a list of currently supported tools:
| Tool | Description |
|---|---|
| Harmonize | Harmonize PlanetScope imagery with Sentinel-2. |
| Top of Atmosphere Reflectance (TOAR) | Convert Analytic assets from radiance to reflectance. |
| Clip | Clips imagery assets to your area of interest. |
| Reproject | Reproject, resample, and rescale imagery products to a new projected coordinate system and resolution. |
| Band Math | Apply mathematical expressions using the spectral bands of Planet imagery to produce outputs and indices. |
These tools help to leverage PlanetScope data for visualization and analysis. For example, in agricultural field monitoring applications, the Clip tool is critical for reducing the size of the data because the area of a field is likely much smaller than the area of a PlanetScope scene. The Clip tool clips the rasters that are delivered to the extent of your AOI, as defined in your parameters when you create a Subscription. By clipping the data, you can reduce your cloud storage costs, analyze data faster, and visualize data in mapping applications more efficiently and effectively.
The Harmonize tool adjusts the Surface Reflectance measurements from PlanetScope instruments to align them with Sentinel-2. The tool is helpful when performing analysis across multiple PlanetScope sensor types from archive data because it minimizes scene-to-scene and sensor-to-sensor variability. This tool is especially useful when working with Dove Classic data as newer Doves, including SuperDoves, are already closely aligned with Sentinel-2. However, this tool has caveats and should be tested in your area of interest as it may not work as well in areas of rapid change (agricultural fields) or when scenes include bodies of water. For more information, please read: Scene Level Normalization and Harmonization of Planet Dove Imagery.
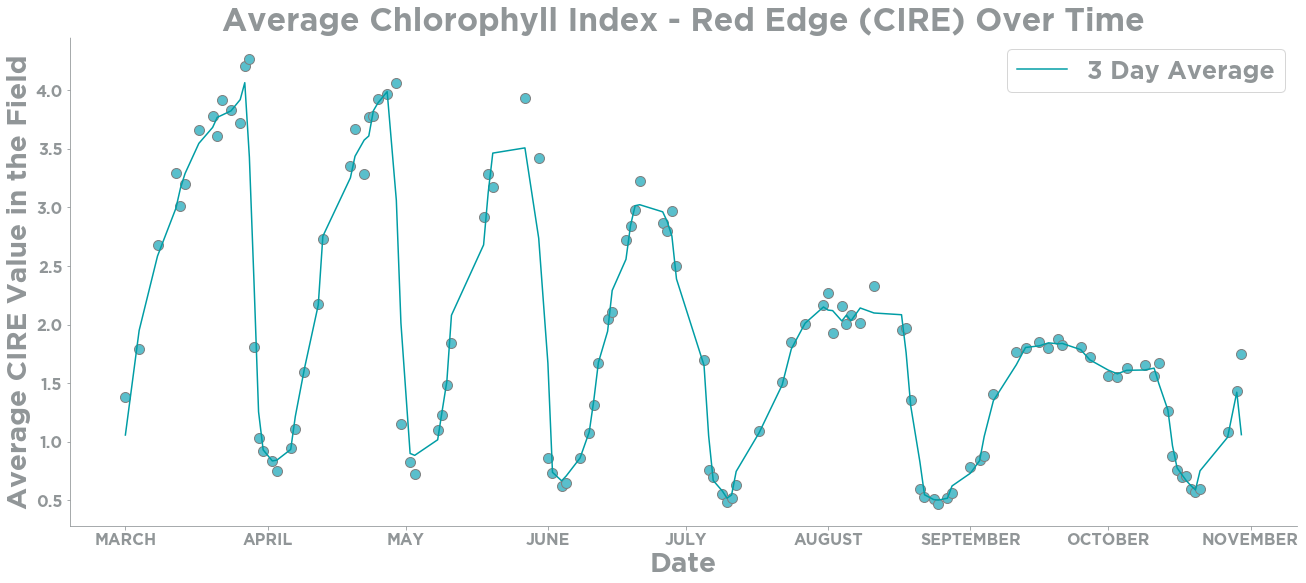
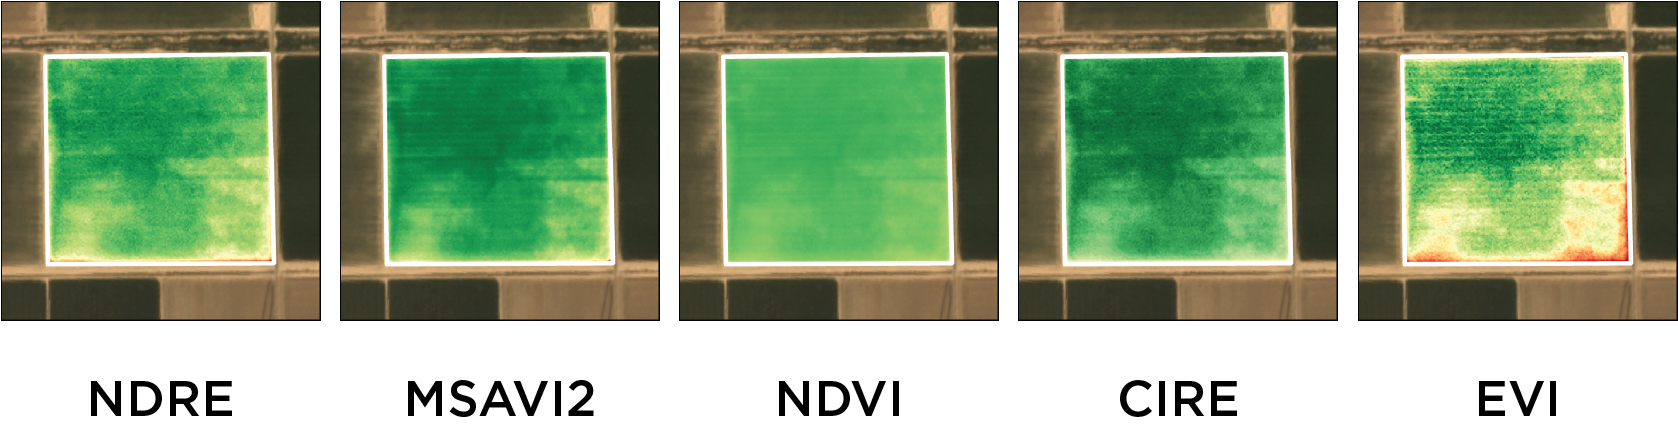
Another very useful tool for agriculture is Band Math. PlanetScope imagery captured by the SuperDove fleet includes 8 spectral bands which can be used for true color and false color visualizations. The Band Math tool in the Subscriptions API enables you to perform calculations using the different spectral bands and store the resulting values in a new raster. These 8 spectral bands can also be used to create indices such as:
| Acronym | Index Name | Formula |
|---|---|---|
| NDVI | Normalized Difference Vegetation Index | ( NIR - R ) / ( NIR + R ) |
| NDRE | Normalized Difference Red Edge | ( NIR - RedEdge ) / ( NIR + RedEdge ) |
| CIRE | Chlorophyll Index Red Edge | ( ( NIR / RedEdge ) - 1 ) |
| MSAVI2 | Modified Soil-adjusted Vegetation Index 2 | ( 2 * NIR + 1 - sqrt ( ( 2 * NIR + 1 ) ^ 2 - 8 * ( NIR - RED ) ) ) / 2 |
| EVI | Enhanced Vegetation Index | 2.5 * ( NIR - RED ) / ( NIR + 6 * R - 7.5 * B + 1 ) |
Band Math creates an additional imagery output file which supports up to 15 bands with different calculations. Computation for calculating indices is completed before the imagery arrives in your cloud storage, reducing the time and steps you need to take to build your final solution.
Cloud Delivery & Format
Now that we have created a Subscription for our AOI & TOI, and we have defined our processing tools, we are ready to deliver the data. When you create a Subscription you need to define your cloud storage destination from one of the supported delivery options. Using the File Format tool, you can also specify the file format for the rasters that are delivered as Cloud Optimized GeoTiffs (COGs). COGs are a Cloud Native Geospatial data format which is an efficient file format for on-the-fly processing and geospatial visualization. They enable any tool or client to request portions of the file based on the area of interest.
By utilizing the Subscriptions API, you are able to set up a regular delivery of satellite imagery to your cloud storage on a near-daily basis. The imagery can be filtered to fit your criteria and processed to your specifications prior to delivery. The Subscriptions API can reduce the cost and effort needed to prepare your data to be ready for visualization and analysis, ultimately reducing the time it takes for data to reach its end-users for decision making.

Next steps…
The Subscriptions API can be a powerful tool for use-cases where you need historical data and/or ongoing monitoring, making it highly valuable for agriculture monitoring. You can find documentation for the Subscriptions API in the Developer Center and sample notebooks for using the Subscriptions API in our GitHub repo. Also subscribe to our Developer Newsletter and get more information like this!
On this Earth Day: Join NICFI Satellite Data Program and Access Planet HiRes Tropical Data
By: Luisa Teixeira on April 21 2022
Join NICFI & Access Planet HiRes Tropical Data
Half a century ago, the first Earth Day started an environmental revolution. Since then, many strategies, movements, and actions have been taken to create a more sustainable future. This year, 2022, Earth Day is focused on the engagement of “more than 1 billion people, governments, institutions, and businesses to recognize our collective responsibility and to help accelerate the transition to an equitable, prosperous green economy for all.”
Tropical forests are a critical element in the balance of the global systems. Its loss is not only a major cause of climate change and mass extinction, but also of rising social inequality and instability. In September 2020, the NICFI Satellite Data Program, envisioned by Norway’s International Climate and Forest Initiative (NICFI) started providing free access to satellite images of the tropics to anyone, anywhere. The program was implemented by Kongsberg Satellite Services (KSAT), Airbus, and Planet.
The Program makes high-resolution (<5m per pixel) optical satellite data of the tropics available to all, for the purpose of helping stop deforestation and combat climate change. This includes PlanetScope Visual Mosaics and PlanetScope Surface Reflectance Mosaics from 2015 onwards.
To celebrate this year’s Earth Day theme, “everyone accounted for, and everyone accountable,” we would like to invite you to join the NICFI Satellite Data Program, and to gain access to high-resolution satellite images of the tropics and to take action:
- reduce and reverse the loss of tropical forests
- combat climate change
- conserve biodiversity
- contribute to forest regrowth, restoration and enhancement
- facilitate sustainable development
Dive into the NICFI Satellite Data Program resources
The NICFI Satellite Data Program is making available satellite data over the tropics going back to 2015. There are more than ten thousand registered users, representing more than 145 countries, that have collectively streamed or downloaded more than 30 millions of images. You can become part of this user community by signing up with NICFI Satellite Data Program at Planet.
After signing up, you can discover, preview, stream, and download Planet imagery data in the following interfaces:
- Planet APIs for direct access for searching, downloading and streaming web tiles
- QGIS or ArcGIS plugins to search and download data into desktop GIS tools
- Google Earth Engine integration to access Planet data directly in the GEE environment
- Geospatial data libraries like GDAL
- Planet Explorer for visualizing data online with Planet's web app
User ecosystem
Because satellite images can be used in many different ways and workflows, the NICFI Satellite Data Program serves a vast diversity of individual and organization users with varying degrees of technical expertise.
Purpose Allies
NICFI’s Purpose Allies are key to help amplify the reach and impact of the program by developing tools, promoting knowledge transfer and capacity building in response to specific user group needs. Despite sharing common goals, each Purpose Ally has a different target audience and technical approach, making up an interesting collection of geospatial platforms and tools: Global Forest Watch, Mapbiomas, Sentinel Hub, and UN-FAO’s SEPAL & Collect Earth.
Global Forest Watch
Global Forest Watch (GFW) “is an online platform that provides data and tools for monitoring forests. By harnessing cutting-edge technology, GFW allows anyone to access near real-time information about where and how forests are changing around the world.” Through GFW, the Planet-NICFI basemaps have been visited more than 170 thousand times since the beginning of the program. MapBuilder allows users to “combine their own datasets with GFW’s cutting-edge data and analysis tools” in ArcGIS Online. The source code for GFW is on GitHub, available under a MIT License.
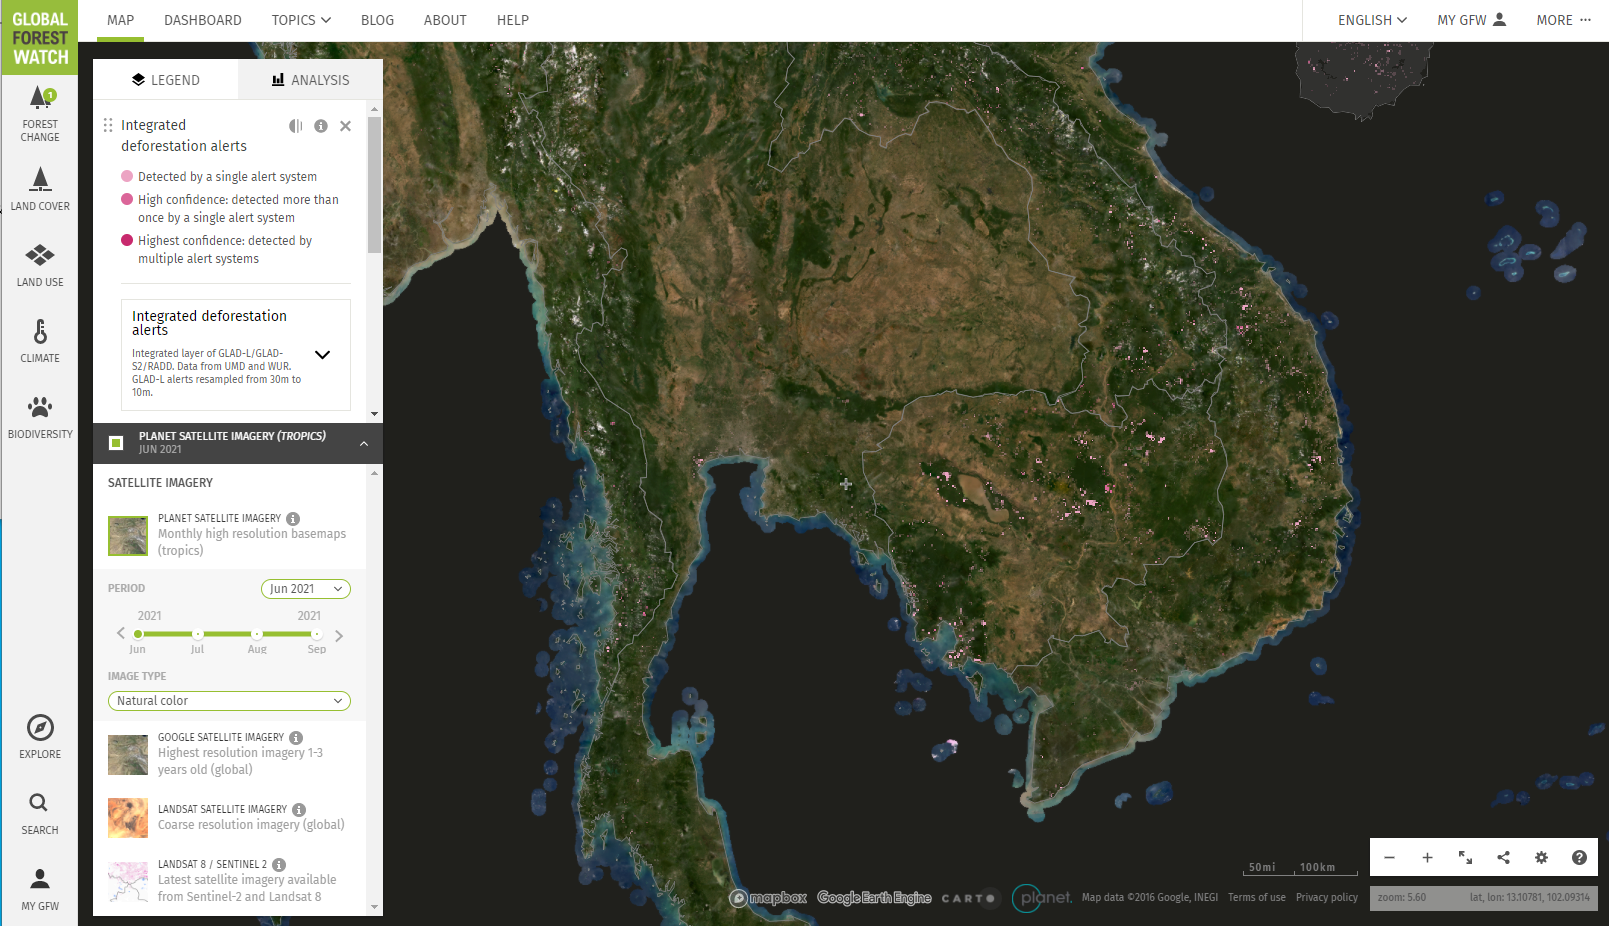 Planet-NICFI basemap in GFW showing natural color contextualization of integrated deforestation alerts in Mainland Southeast Asia
Mapbiomas
MapBiomas is a network of land use and biomes experts, remote science specialists and computer scientists dedicated to map and monitor all land cover and land use changes happening in Brazil, Indonesia and throughout South America. Besides integrating the Planet-NICFI basemaps into their land cover and land use platform they develop a series of scripts, tools and plugins dedicated to land cover land use maps based on multiple geospatial data and technologies.
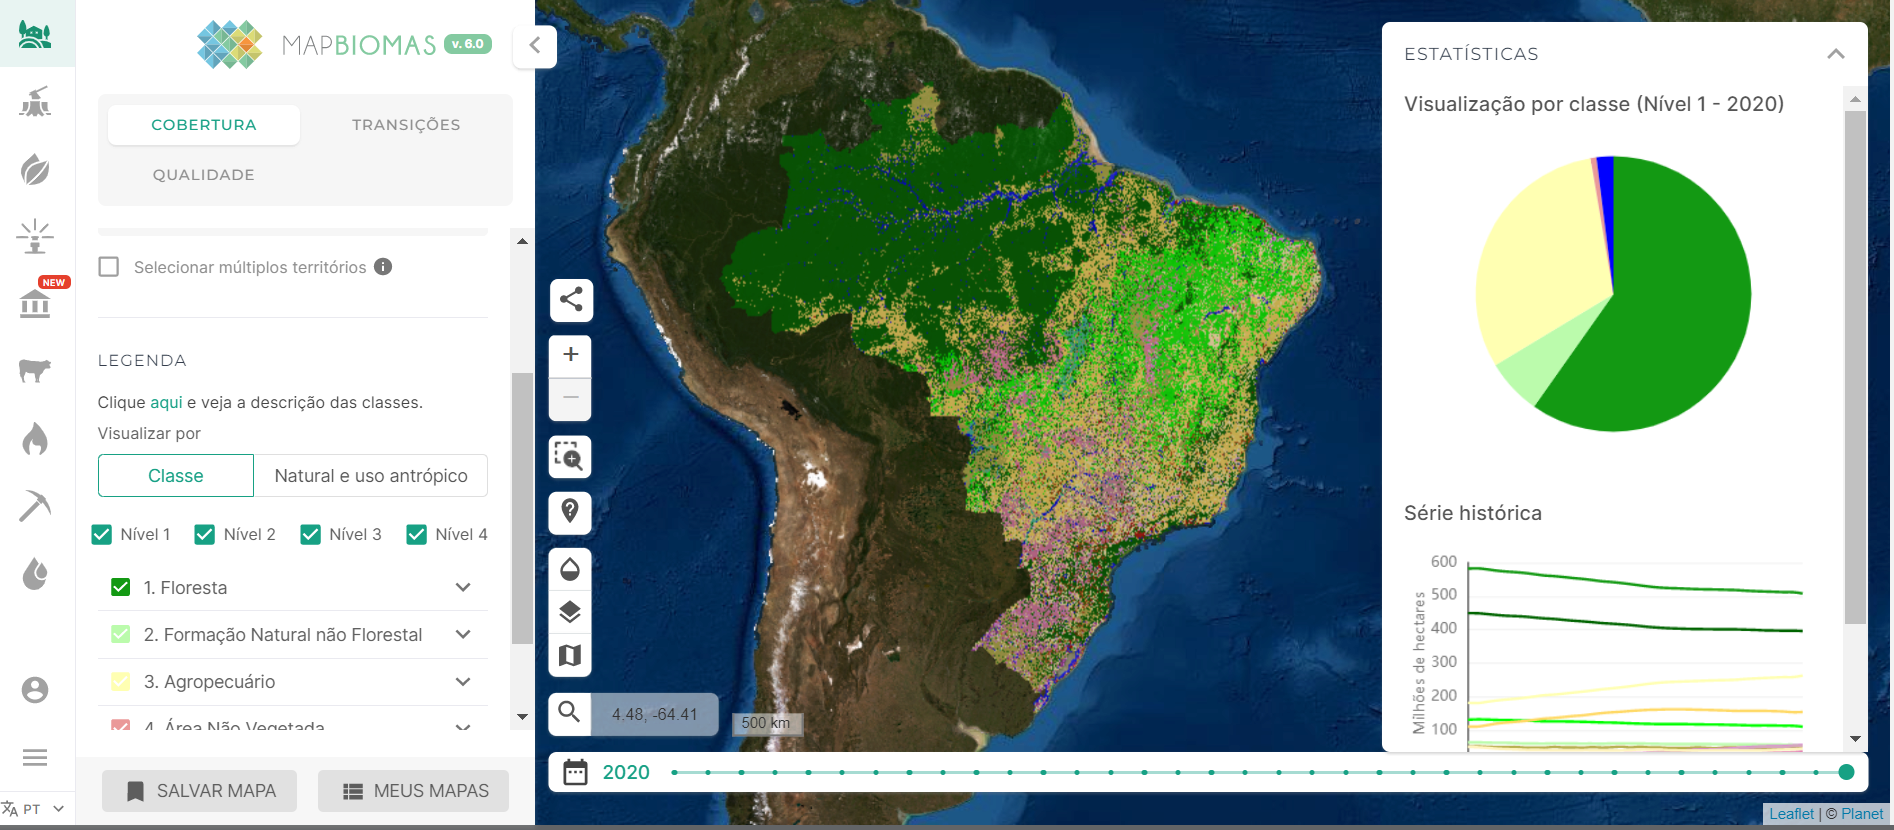 Mapbiomas displaying Brazil land use/land cover data overlaid on NICFI Tropical basemap
Sentinel Hub
Sentinel Hub is a cloud-based API that makes Earth Observation imagery seamlessly accessible for browsing, visualization and analysis, directly in one’s existing application or machine learning workflow. In addition to providing tech and extensive documentation, Sentinel Hub offers open source code and regularly organizes competitions for its developer community.
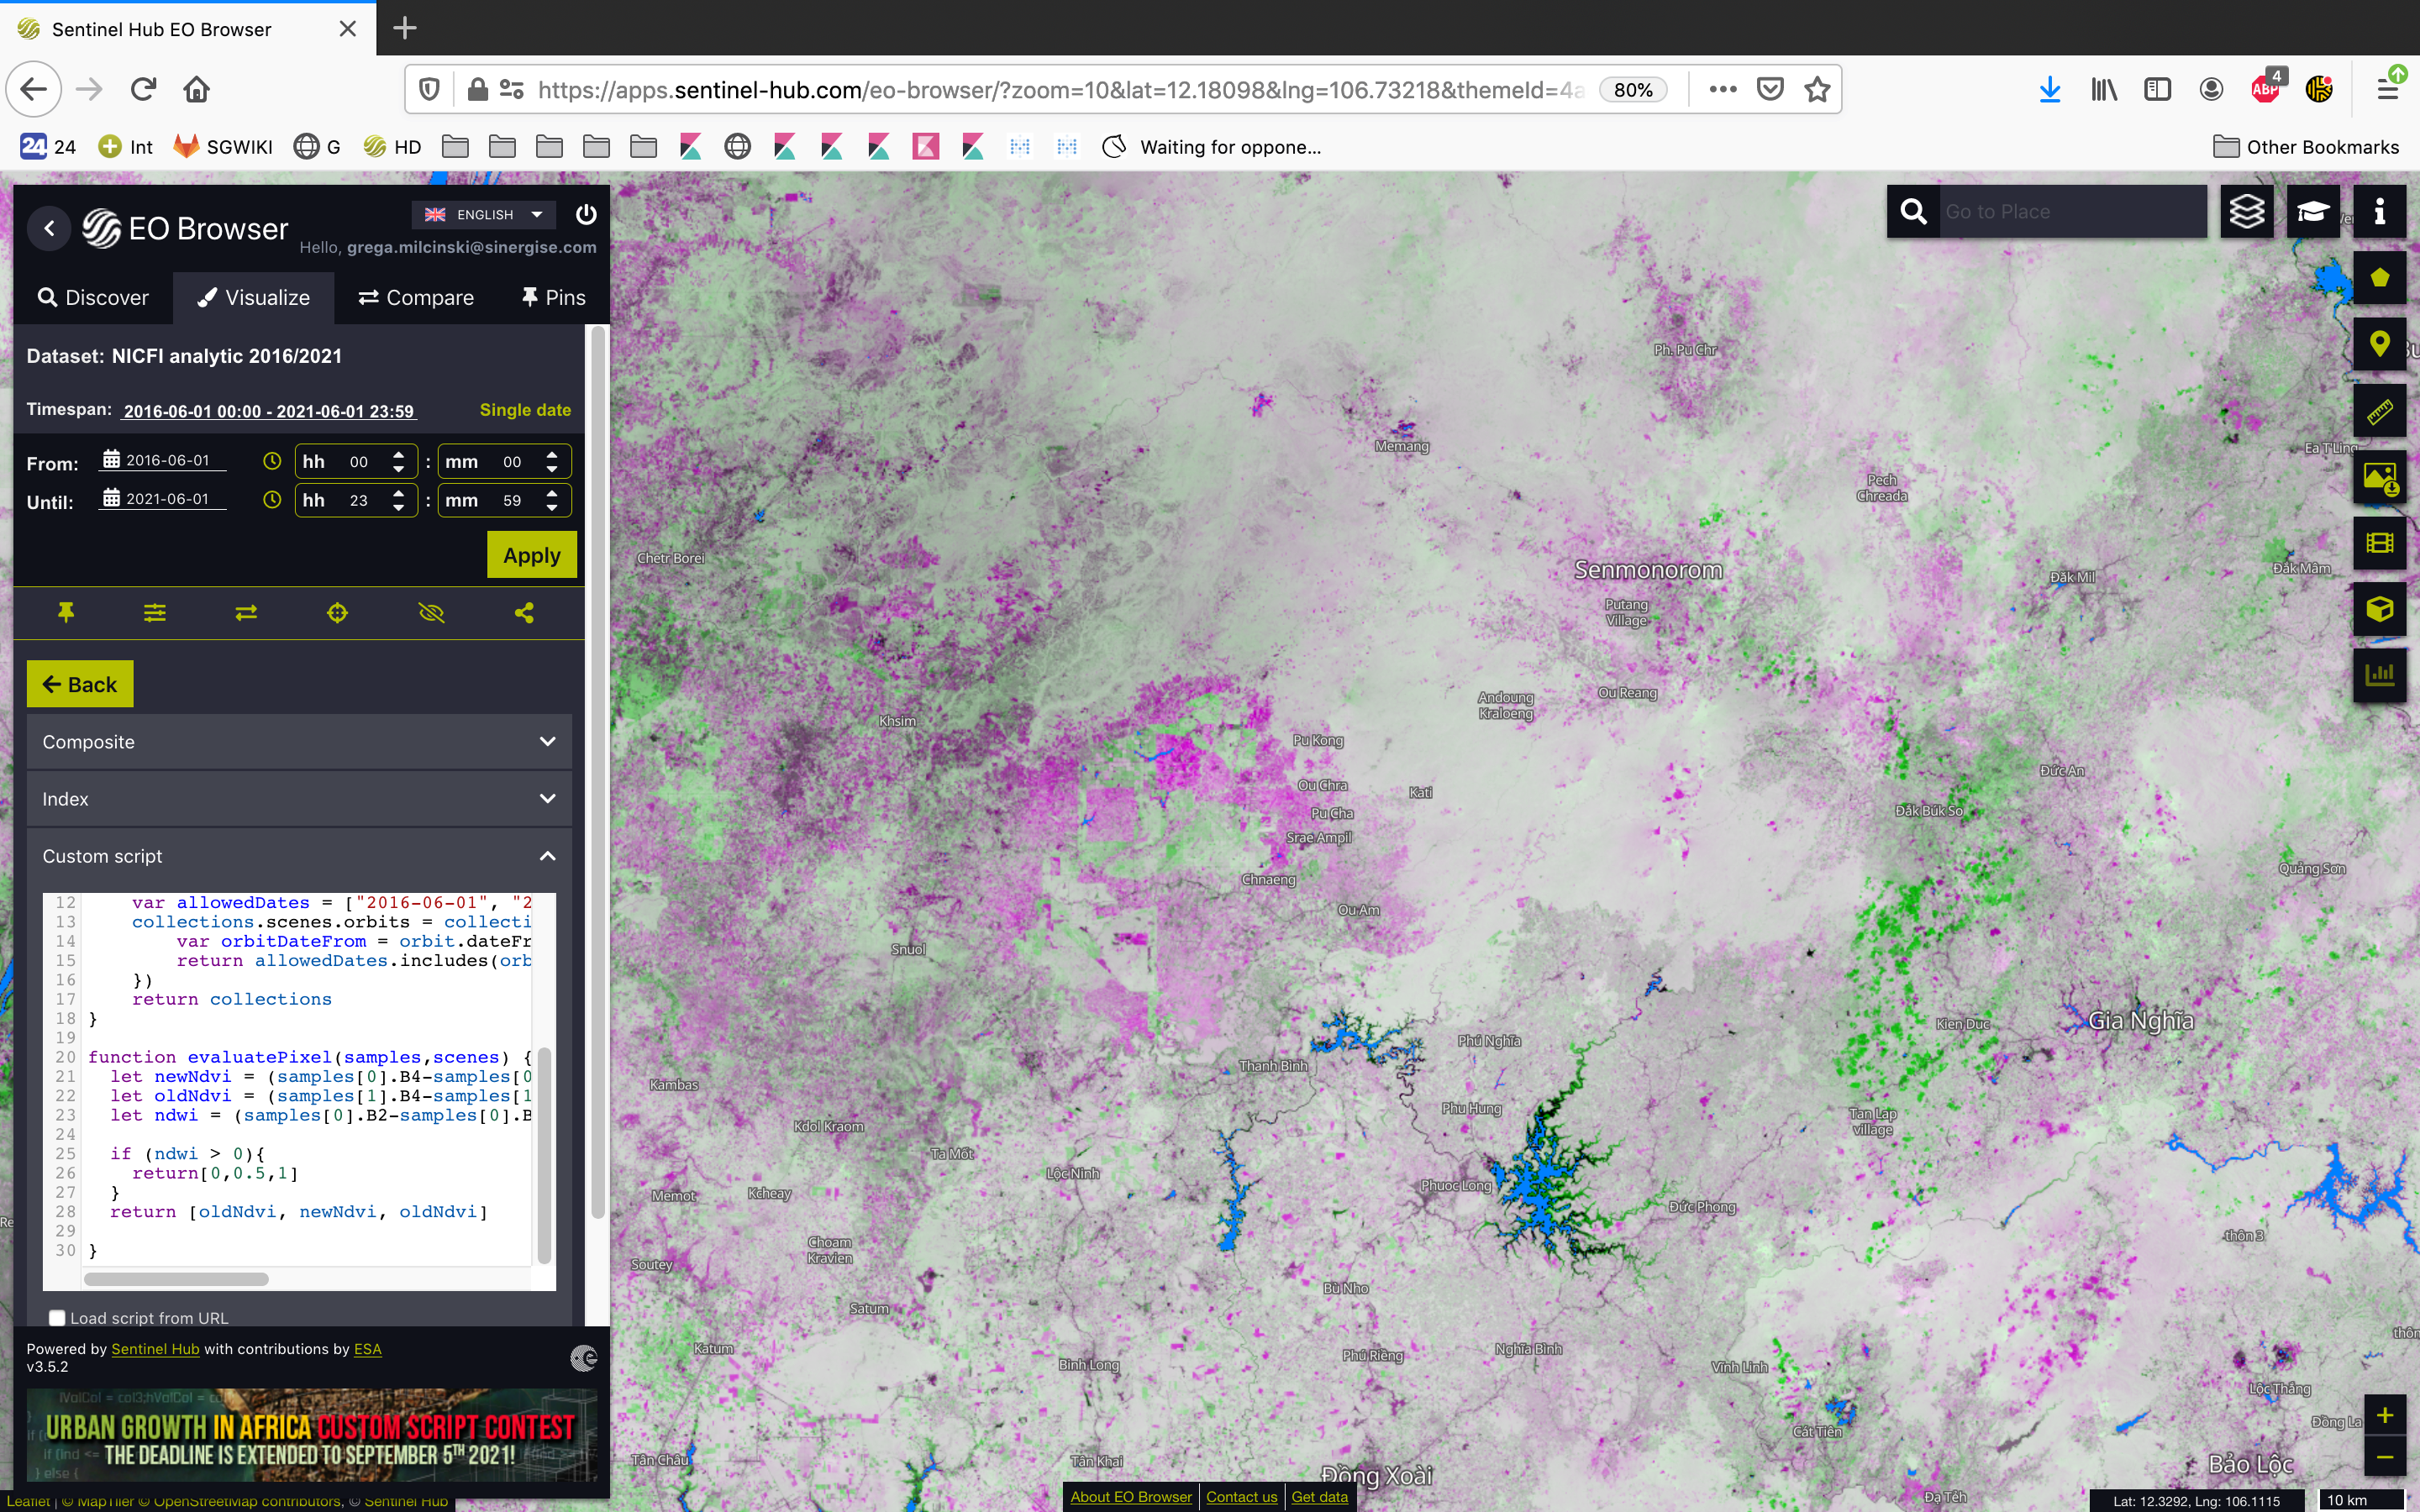 Planet-NICFI imagery data processing within Sentinel Hub’s EO Browser for the identification of areas with change of vegetation over time
UN-FAO
UN-FAO, “in collaboration with over 70 countries and partners, has developed a suite of [open source] innovative forest and land monitoring tools, conceived to meet the urgent need for (national and local) systems that enable accurate yet cost-effective measurement, monitoring, and reporting of forest and other land cover.” SEPAL and Collect Earth, two of the Open Foris tools, now integrate Planet-NICFI data that can be used by “over 9,000 users from 185 countries” to monitor and report on their ecosystems, namely for the UNFCCC.
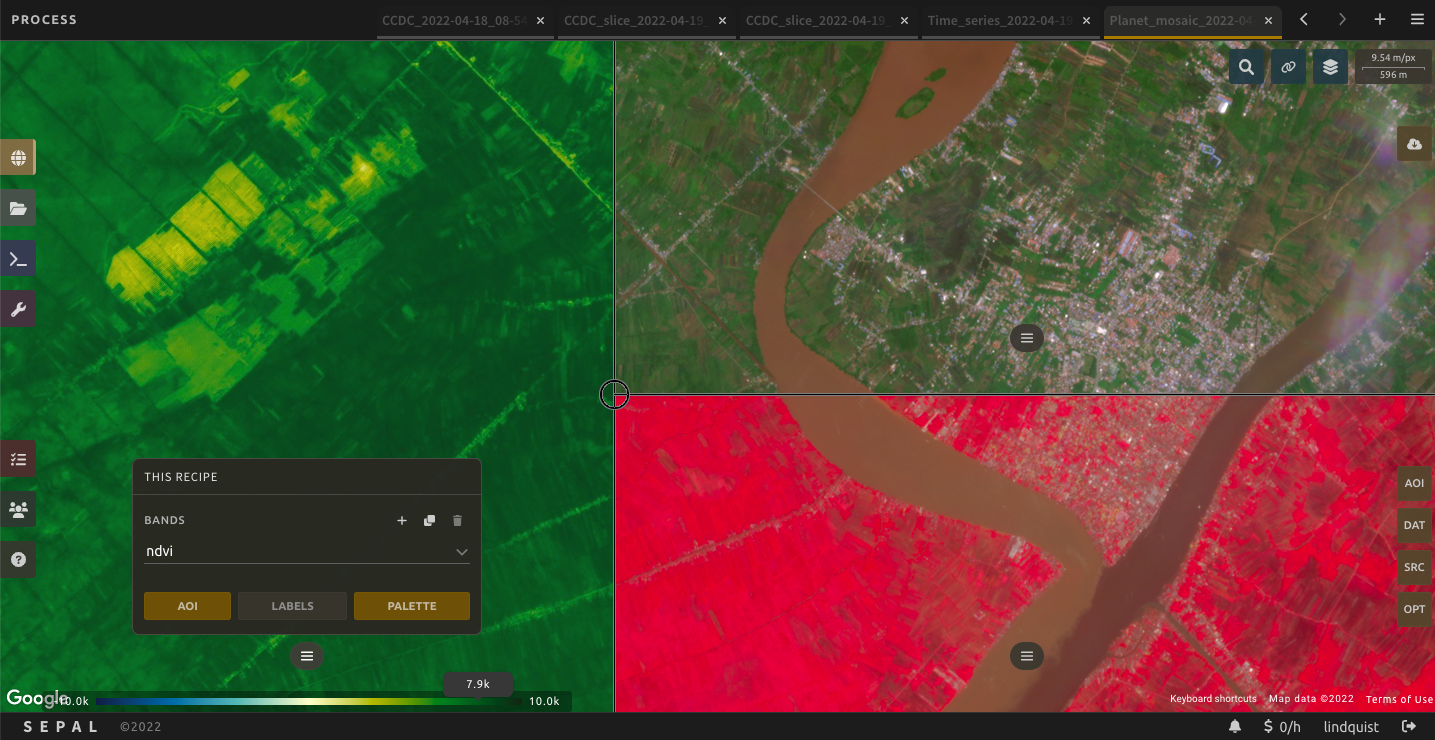
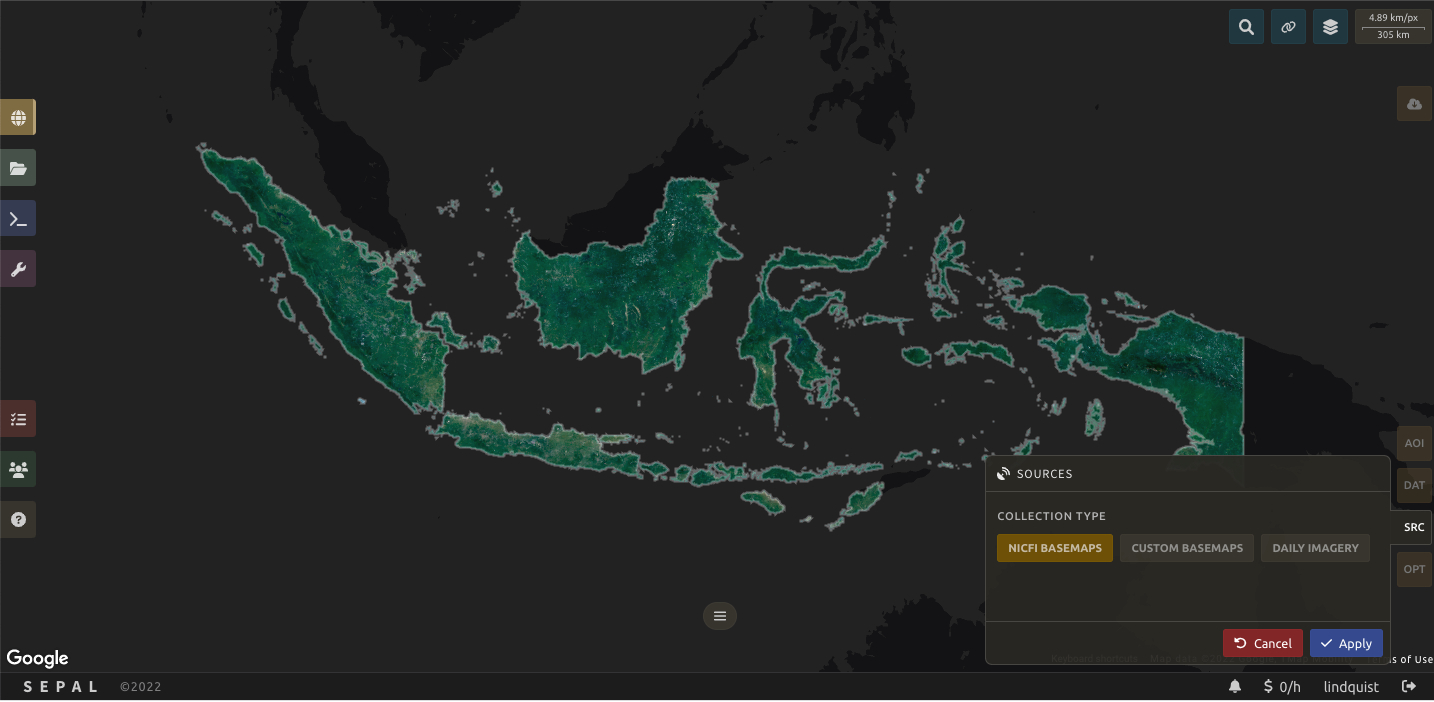 SEPAL interface with NICFI-Planet basemaps
Platform Partners
The NICFI Satellite Data Program has been proactively working to establish collaboration to further increase its reach, as well as to elevate its users' resources and efforts. Acknowledging that there is no unique solution to our planet’s problems, the Program tries to engage and adjust to the strategies that different sectors of activity may adopt in their efforts to tackle deforestation, biodiversity loss, and the climate crisis.
Google Earth Engine (GEE) supports geospatial processing at scale, powered by the Google Cloud Platform. In GEE you can find “petabyte-scale catalog of public and free-to-use geospatial datasets” including, since September 2021, the Planet NICFI Basemaps for Tropical Forest Monitoring. Moving data to GEE was enthusiastically received by the NICFI community of users, who are experimenting with time series algorithms like LandTrendr and deep learning with TensorFlow. Of about 11,000 registered NICFI registered users, currently more than 1,300 are using Google Earth Engine to analyze the Planet-NICFI Basemaps and benefiting from the speed and scale of hosted cloud computing. Any given day, there are between 400 and 600 active analyses of the high-resolution tropical monitoring data being run on the platform.
The GEO-Microsoft Planetary Computer partnership is supporting selected projects using the NICFI Satellite Data and the Planetary Computer to address environmental challenges. Microsoft’s Planetary Computer “combines a multi-petabyte catalog of global environmental data with intuitive APIs.”
And because communication is crucial to NICFI imagery users, the NICFI Satellite Data Program paired up with Mapbox to create a series of templates and step-by-step instructions for making custom web maps for displaying and comparing NICFI imagery, using Mapbox GL JS.
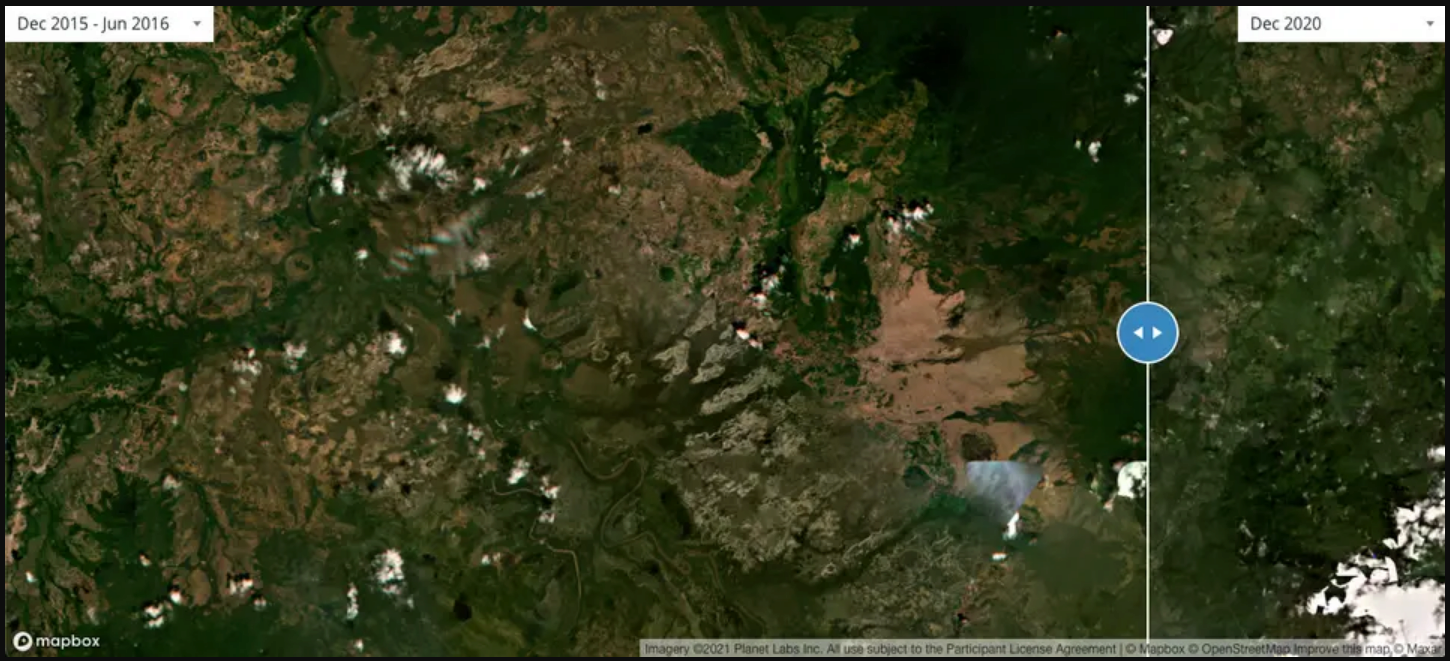 Mapbox GL JS template for swipe interaction to display two sets of Planet-NICFI imagery side-by-side for easy comparison
Here's the code snippet from the Mapbox NICFI Compare tutorial:
   // YOUR TURN: Set the center coordinates and zoom level for the 'before' map on the left
   const beforeMap = new mapboxgl.Map({
       container: "before",
       style: "mapbox://styles/mapbox/satellite-streets-v11",
       center: [2, -2],
       zoom: 2,
       hash: true
   });
   // YOUR TURN: Set the center coordinates and zoom level for the 'after' map on the right
   const afterMap = new mapboxgl.Map({
       container: "after",
       style: "mapbox://styles/mapbox/satellite-streets-v11",
       center: [2, -2],
       zoom: 2,
       hash: true
   });
   // YOUR TURN: Add your Planet NICFI API key
   const NICFI_API_KEY = "{YOUR_NICFI_API_KEY}";
Developer community
In the first year of the Program, the majority of the outreach activities, and training, were designed and directed at professionals working in the forestry, land use change and, generally speaking, earth observation industries. NICFI Satellite Data Program was the topic of a FOSS4G Session and Hackathon in October 2021, and featured in Geo for Good in November of the same year.
Your path to exploring NICFI data
With the most recent IPCC Report that concludes that we have less than a decade to reverse course on global emissions, this is the time to invest in our planet. This means our business, politics, and daily action all count. We have already achieved a lot, but we need better solutions, new approaches, and collaboration because we believe “Everyone accounted for, and everyone accountable.” And once again, to celebrate Earth Day 2022, we would like to propose your developer path to NICFI Satellite Data exploration on this Earth Day 2022:
- Sign up
- Get a Planet API key
- Download the tropical basemaps or quads to view NICFI mosaics
- Read through the NICFI User Guide, especially the NICFI Basemaps addendum
- Use the Planet Basemaps API to visualize imagery over time
- Check out other interfaces, such as the Google Earth Engine NICFI integration
- Reach out to nicfi-servicedesk@ksat.no if you have a question or need support regarding the NICFI Satellite Data Program.
Next steps
Learn more
Planet NICFI products and services
Get in touch with Planet Developer Relations
To get updates from the Planet Dev Rel team in the future, follow our blog feed.
To reach out to the Developer Relations team directly, send us an email via developers@planet.com.
Hello, World!
By: Sara Safavi on April 11 2022
Introducing Planet's new Developer Blog
Who are we?
We're Developer Relations at Planet: a team of curious geo-people, passionate space nerds, Pythonistas, educators and more (most of us wear multiple hats at once, too). We believe in using space to help life on earth, and the way we do that best is by empowering a global community of technical users (that's you!) to do amazing things with Planet's platform and data.
Who are you?
You'll notice that I said technical users above. We know that for many of you, the word "developer" doesn't necessarily capture all that you do. Many of you are Data Scientists or Analysts first. Others might be most comfortable labeling themselves as Remote Sensing or GIS professionals. And some of you may be developers exploring the potential of satellite imagery for the first time. We know, because the same can be said for our team and Planet as a whole. Planeteers come from a variety of backgrounds, each with a unique collection of skills and talents, as do you. The common thread here—and what we mean when we say "developer"—is using Planet's platform and data as a means to a greater end.
So whether you use Planet APIs, a Command Line Interface, GIS Integration or all of the above: you belong here.
Coming Soon
We've got an exciting collection of new content and resources heading your way over the next few months, including:
- An all-new Python SDK & CLI! A developer-first toolkit ready to integrate into your platform & workflows.
- NEW geo-friendly processes & examples!
- More Cloud-Native Geospatial tools! Native STAC support in Planet APIs, COG streaming, GIS integration support, and more.
Get in touch!
To get updates from the Planet Dev Rel team in the future, follow our blog feed.
To reach out to the team directly, send us an email via developers@planet.com.