The Analytic Feeds Viewer is a web application that displays detections from Planet Analytic Feeds and the source imagery. It is designed to help users identify desired objects and features and demonstrate how Planet’s machine learning models perform in certain regions. The Viewer is built entirely on Planet’s public APIs, including our Analytics API and tile services.
You can find our Analytic Feeds Viewer at https://www.planet.com/feeds.
This user guide provides an overview of the functionality of the Viewer and assumes a general understanding of Planet Analytic Feeds. For more information on Analytic Feeds, please refer to https://developers.planet.com/docs/analytics.
Key Features
The following are key features of the Analytic Feeds Viewer. For more detail on our Analytic Feeds, please refer to https://developers.planet.com/docs/analytics/.
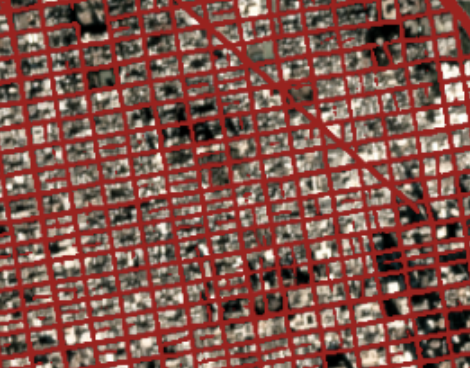
Raster Geotiffs
Certain Analytic Feeds, like Buildings, have outputs formatted as raster GeoTIFF outputs. The Viewer displays these detections over their source imagery, either Planet Basemaps or Planet imagery.
Vector Bounding Boxes
Certain Analytic Feeds, like Vessels, have outputs formatted as vector bounding boxes. The Viewer displays these detections and their source imagery, either Planet Basemaps or Planet imagery.
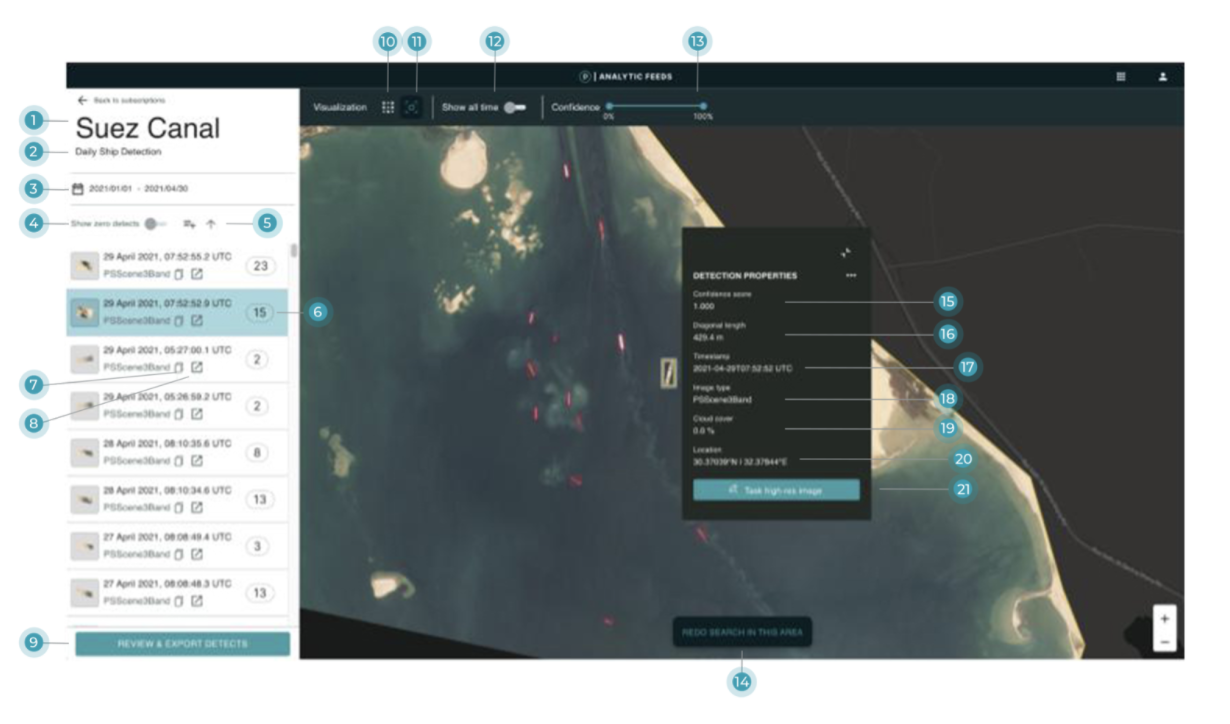
Redo Search Option
When zoomed into a particular area within a subscription, the option to redo the search for detections within the viewable window will pop up.

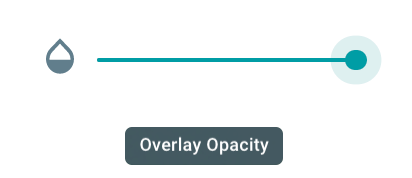
Transparency Slider
Use the transparency slider to compare raster GeoTIFF outputs to the underlying source imagery and easily see what features resulted in detections.
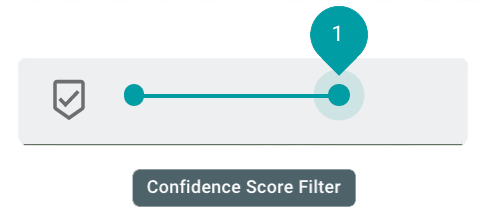
Confidence Score Filtering
Each detection contains a confidence score representing how likely it is that the detection is a true positive detection. Use the confidence score filtering feature to show bounding box detections with higher confidence and remove false positives with lower confidence scores.
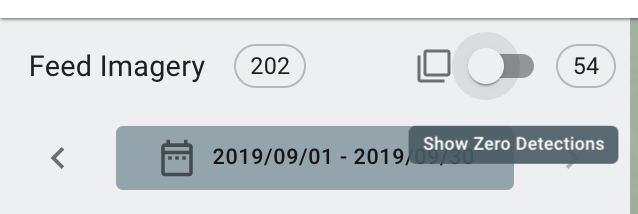
Toggle For Scenes Without Detections
There may be times when a PlanetScope or SkySat scene has zero detections that day. By default, the Viewer does not display these scenes. However you can use the toggle feature to display images with zero detections.
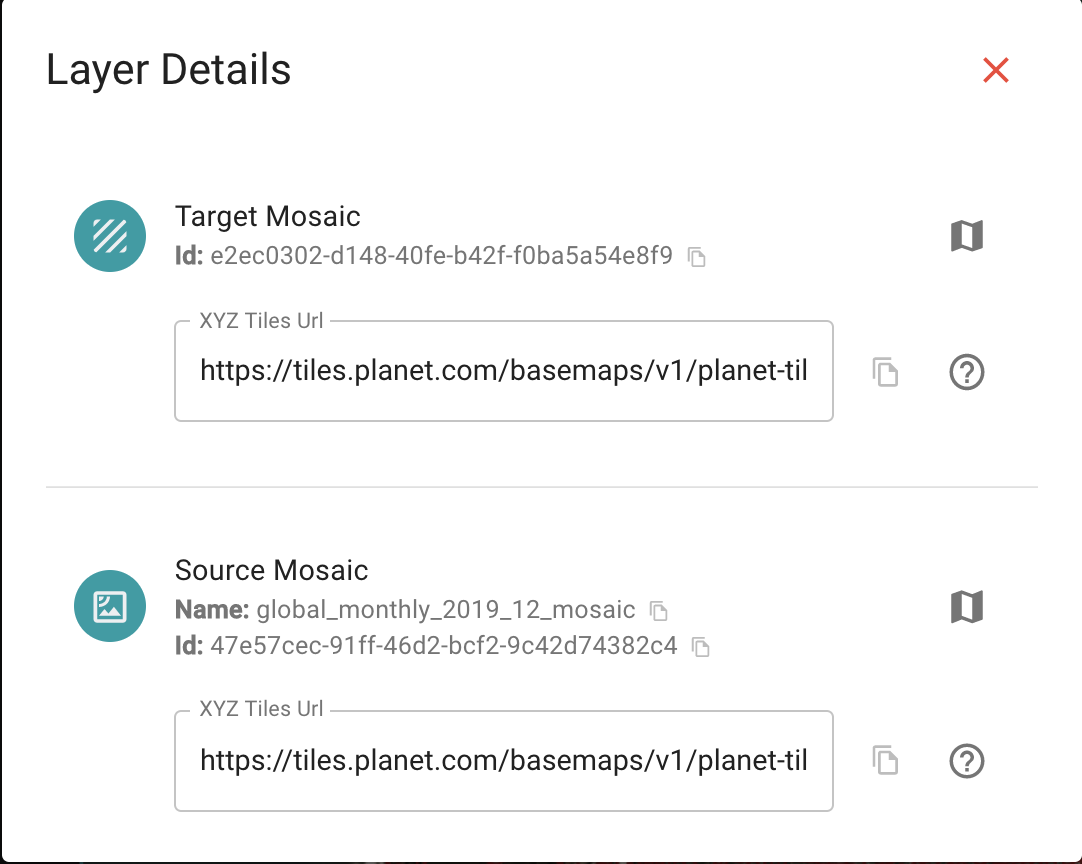
XYZ Tile Services
The Viewer surfaces the XYZ tile API URL so you can stream raster GeoTIFF outputs in your GIS platform of choice.
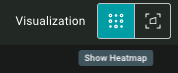
Heatmap Visualization
The Viewer includes an option to view detections as a heatmap to help point you to where you need to focus first.
Toggle to See all Detects
All detections within the filtered time period can be shown at once by selecting the Show All Detects option.

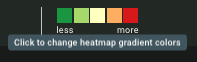
Choose Your Own Color Palette
The heatmap visualization can be altered to reflect different color ramps.
Compare Imagery Over Time
View how your area has changed over time and let Planet’s detections guide you to where the most change has taken place

Review and Export
Cycle through detections to quickly remove false positives and export a clean dataset for further analysis.

We are continually working to improve our technical documentation and support. Please help by sharing your experience with us.