| Number | Description |
|---|---|
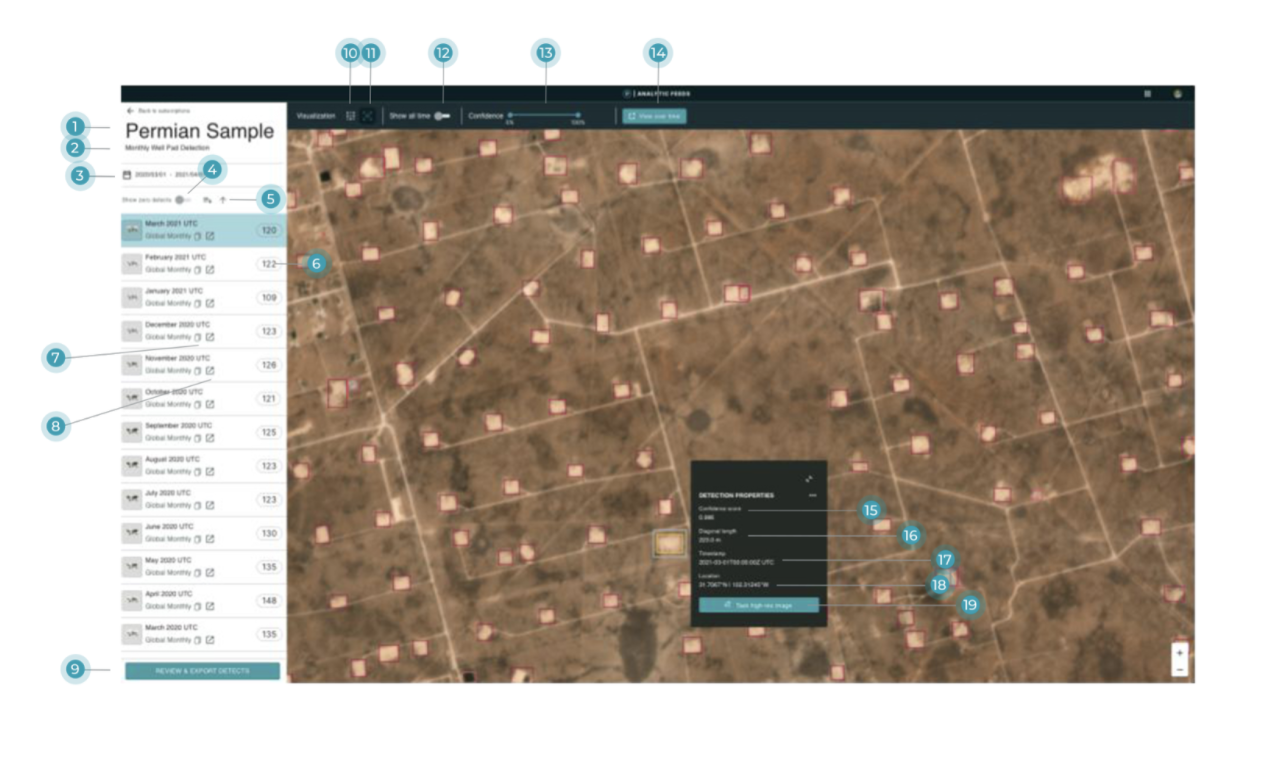
| 1 | Title of the Subscription. Generated manually by the Planet Account Manager. |
| 2 | Subscription Description Description of the Subscription. Each Subscription generates a description that is designed to give additional information about what the Subscription is for. |
| 3 | Date Filter. Choose the dates you wish to see. The dates you select must be within the Subscription start and end dates. |
| 4 | Toggle for Basemaps without Detections. There may be times where a Planet Basemap has zero detections. By default, the Analytic Feeds Viewer does not display these Basemaps, but you can toggle on the display of Basemaps without detections. |
| 5 | Results Sorting. Use this toggle to determine the order in which you wish to view results. Sort by date or number of detections. |
| 6 | Number of Detections within the Image. The number of detections found within the image. |
| 7 | Link to Explorer. Click this link to view imagery within the same AOI or that you have access to in Planet Explorer. |
| 8 | Scene ID. This is the unique ID for the scene that was processed for the detection. |
| 9 | Review & Export. Enables you to export detections as a geojson file. |
| 10 | Visualization Option: Heatmaps. Choose to see a heatmap of detectionsor each individual detection. |
| 11 | Visualization Option: Individual Detections. Choose to see individual detections. |
| 12 | Show all Time. This will toggle whether you see only detections for the selected time period or all time periods shown. |
| 13 | Confidence Score Filter. Use the confidence score filtering feature to show bounding box detections with higher confidence and remove false positives with lower confidence scores. |
| 14 | View Over Time. View how your area has changed over time and let Planet’s detections guide you to where the most change has taken place |
| 15 | Confidence Score. A score (0 - 1.0) of how likely it is that this detection is a true positive (correct) detection |
| 16 | Detection Diagonal Length. The measurement in m of the diagonal length of the bounding box detection. This can be a good proxy for object length. |
| 17 | Image Acquisition Timestamp. The time at which the image was captured - this reflects the time that the object detected was present. |
| 18 | Location. The Latitude and Longitude of the centroid of the detection. |
| 19 | Link to Tasking Dashboard. Task a skysat to capture a high resolution image of the area. Note: You must already have access to the Tasking Dashboard |
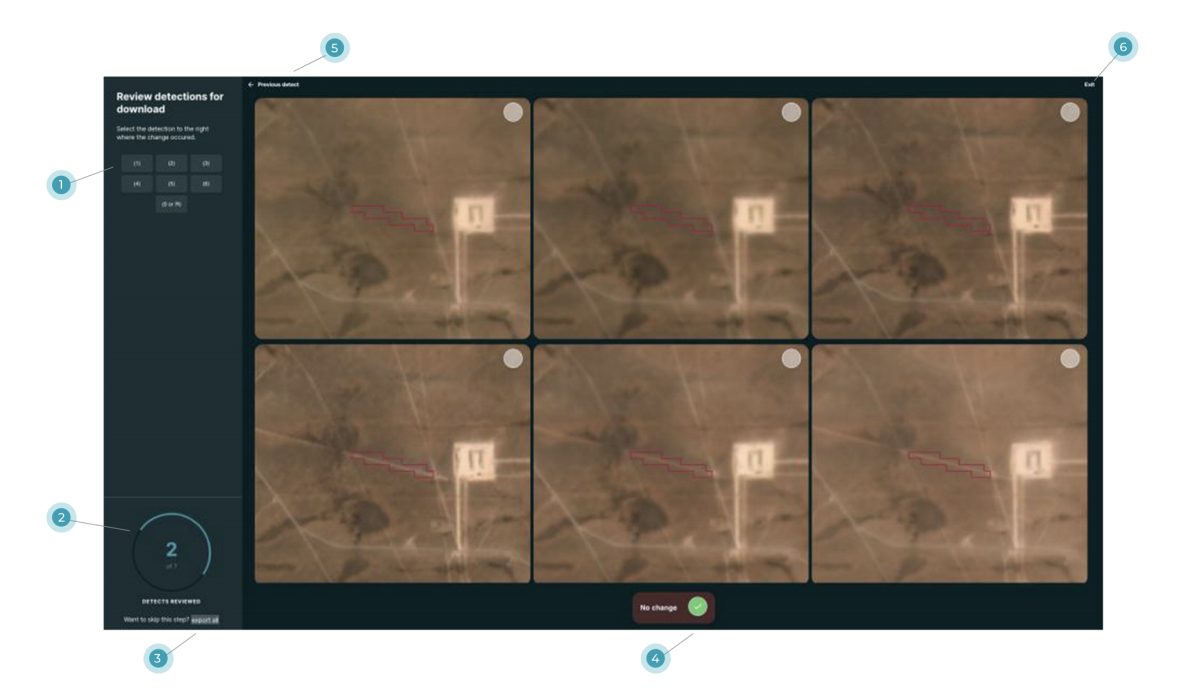
Through the Review & Export flow, you’ll be able to quickly cycle through change detections shown on-screen, selecting the time period where you first see the change take place. After reviewing all detections, you’ll export the change detections into a clean dataset.
Note: Your progress will not be saved once you leave the review flow. You’ll need to review all detections or export the entire dataset.
| Number | Description |
|---|---|
| 1 | Keyboard Shortcuts. Using the number keys, you can quickly select the time period which corresponds to when the change occurred. |
| 2 | Progress Bar. You’ll see how many detections you’ve reviewed and how many more there are to go. |
| 3 | Export All. You can bypass the review flow and export all detections |
| 4 | No Change. Occasionally, you’ll run into false positive change detections - select “No Change” when you find a detection that doesn’t show change. |
| 5 | Previous Detect. Go back to the previous detection |
| 6 | Exit. Return to the main Feed Viewer display. |
Rate this guide: