Overview
The Crop Biomass is a fusion of microwave and optical satellite imagery, using the advantages of each to accurately estimate relative aboveground crop biomass regardless of cloud cover and at a spatial resolution of 10-meters. Crop Biomass is only available over agricultural fields.
This product integrates microwave data from the European Space Agency (ESA) Sentinel-1 satellites and optical images from Sentinel-2 and PlanetScope. The output from these combined data sources is fused in an algorithm designed to provide a reliable measurement of crop biomass over agricultural areas. This is a relative measure of biomass, so each pixel value has a value of 0 (low biomass) to 1 (high biomass). The product is provided daily and in near real time (latency <24 hours).
Planet's Crop Biomass: A Planetary Variable
The Crop Biomass uses the vegetation signal derived from cross polarizations of microwave observations in combination with a vegetation index from Sentinel-2 and PlanetScope. The vegetation signal in the microwave region is different to the one in the optical domain. The microwave signal is a direct function of the vegetation water content, dielectric properties of the water within the vegetation, and the vegetation structure (Ulaby et al., 1986; Kerr et al., 1994). Considering the strong relationship between vegetation water content and vegetation biomass, this microwave information is, in this case, used as a biomass indicator for crops (Vreugdenhil et al., 2018; Khabbazan et al., 2019). On the other hand, in optical imagery, spectral indices are used to estimate the vegetation conditions. The spectral measurements in the visible region are sensitive to the chlorophyll content, while the measurements in the near infrared are sensitive to the mesophyll structure of the leaves (Townshend, 1993).
Planet offers the Crop Biomass since 2019, with the following features:
- Daily for timely decision-making
- Cloud-free for continuous and consistent feed of observations
- Analysis-ready
- Mid-resolution (~10m)
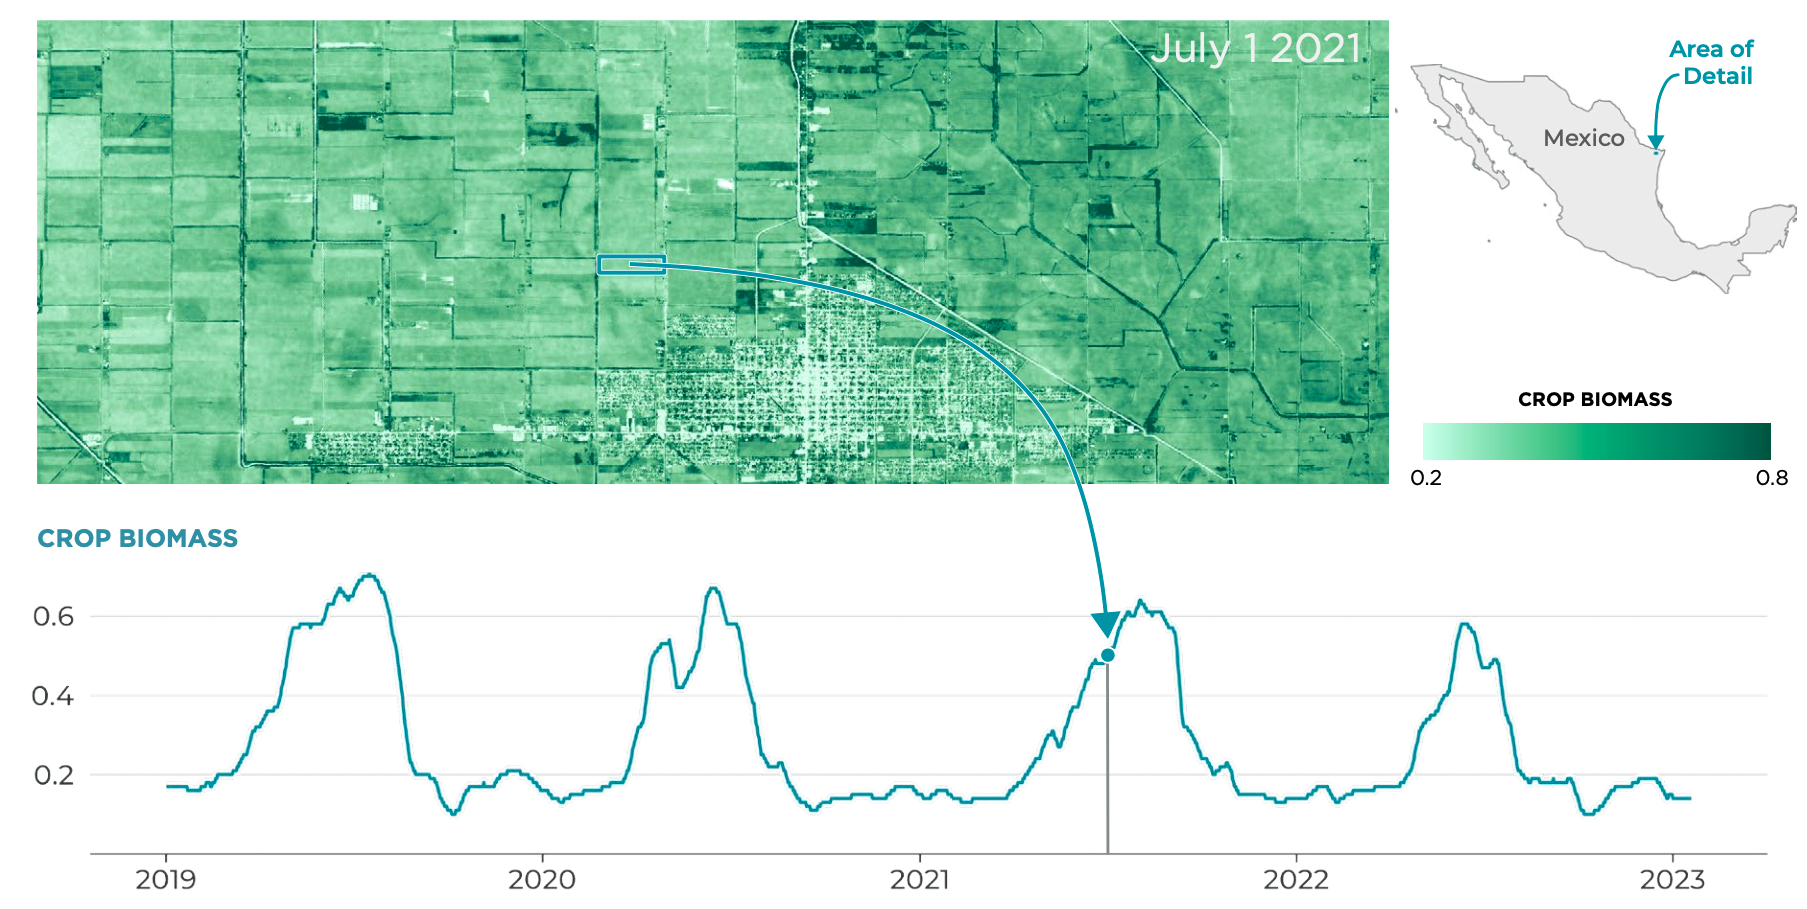 Figure 1: Measurements of Crop Biomass in eastern Mexico. The image above demonstrates both the spatial variability of the biomass for a single date (July 1, 2021), as well as the average biomass of the marked field over a timespan of four years.
Product Specifications
Table 1: Crop Biomass product specification
| Data Resource | Crop Biomass |
|---|---|
| Source ID | BIOMASS-PROXY_V4.0_10 |
| Version | 4.0 |
| Unit | None |
| Pixel Size | 0.000089° (±10x10 m) |
| Temporal Resolution | daily (365 observations per year) |
| Geographical Coverage | Global |
| Data Availability | 2019-01-01 - Present |
| Satellites Used | Sentinel-1, Sentinel-2, Planetscope |
| NRT Latency | Daily at 6am local time |
| Archive Latency | Less than 4 hours after creating a subscription |
Version 3 deprecated
As of December 1, 2024, BIOMASS-PROXY_V3.0_10 has been officially deprecated. We encourage all users to migrate to the latest version (BIOMASS-PROXY_V4.0_10) to benefit from enhanced features, updates, and continued support (FAQ).
For assistance with the transition, please contact your Customer Success Manager.
Asset Properties
The table below specifies the properties of the data assets that are delivered by the Planet Subscriptions API.
Table 2: Asset properties of CB data resource
| Asset Name | Band Name | Unit | Type | Typical Range | No Data Value | Scale | Format (coordinate system) |
|---|---|---|---|---|---|---|---|
| CB | Band 1 | Relative | UINT16 | 0 - 1 | 65535 | 0.001 | GeoTIFF (EPSG:4326) |
Methodology
Sentinel-1
The Crop Biomass product leverages Sentinel-1's Synthetic Aperture Radar (SAR) data, focusing on the Cross Ratio (CR) index derived from VH (Vertical-Horizontal) and VV (Vertical-Vertical) polarizations. Sentinel-1's ability to penetrate clouds and collect data under all weather conditions makes it invaluable for agricultural monitoring, especially in regions with frequent cloud cover.
The CR index highlights vegetation structure and water content while minimizing the influence of soil moisture and surface roughness, which can otherwise obscure the biomass signal. To ensure the accuracy of the CR index, the data undergoes preprocessing steps that include speckle filtering to reduce noise and orbit correction to normalize the effects of varying incidence angles and azimuth angles across different satellite passes.
The resulting CR time series is then scaled to match the range of the Normalized Difference Vegetation Index (NDVI) from optical data. This scaling is crucial for fusing the radar and optical signals, allowing for a more accurate representation of crop biomass over time.
Optical
Sentinel-2
Sentinel-2 provides high-resolution optical imagery, which is critical for capturing the spatial variability of crop biomass. The primary index used from Sentinel-2 is the Normalized Difference Vegetation Index (NDVI), calculated from the reflectance values in the red (Band 4) and near-infrared (Band 8) regions of the electromagnetic spectrum. NDVI is widely recognized for its sensitivity to chlorophyll content and vegetation health, making it an excellent proxy for biomass.
Sentinel-2 data is preprocessed to remove clouds, snow, and any man-made structures such as green houses, roads, or buildings. To address gaps in temporal coverage due to clouds or infrequent satellite passes, a dynamic interpolation method is used, extrapolating partially cloud-covered images by referencing the most recent cloud-free image. This approach ensures a continuous time series of NDVI values.
PlanetScope
PlanetScope imagery, with its higher revisit frequency, complements Sentinel-2 by filling in temporal gaps. This additional data source is especially valuable in regions with persistent cloud cover or during critical growing periods when timely biomass data is essential. The integration of PlanetScope data enhances the spatial and temporal resolution of the Crop Biomass product, making it more robust and reliable.
Data Fusion and Scaling
The core innovation of the Crop Biomass product lies in its data fusion methodology, which integrates the temporally consistent radar signal from Sentinel-1 with the spatially detailed optical signal from Sentinel-2 and PlanetScope.
Paper
You can read more about the methodology in the IEEE published paper: The Biomass Proxy: Unlocking Global Agricultural Monitoring through Fusion of Sentinel-1 and Sentinel-2 (Burger et al., 2024).
This fusion process is conducted in two main steps:
-
Temporal Fusion: The CR and NDVI time series are combined at the field level using a dynamic weighting strategy. This strategy assigns more weight to the most reliable and recent observations, ensuring that the temporal evolution of the biomass signal is accurately captured.
-
Spatial Fusion: Once the temporal signal is established, it is downscaled to a 10-meter resolution by integrating the spatial patterns observed in the optical data. This step involves applying a spatial weighting function that accounts for the variations in both radar and optical signals across the field, resulting in a high-resolution biomass map that combines the strengths of both data sources.
Input Data
Table 3: List of inputs for Crop Biomass production
| Product | Description |
|---|---|
| Radar backscatter | C-Band Synthetic Aperture Radar (SAR) data from the Sentinel-1A Level-1 ground range detected (GRD) product, in the IW mode (downloaded with the SentinelHub Asynchronous API). The product consists of focused SAR data that has been detected, multi-looked, and projected to ground range using the Earth ellipsoid model WGS84. This GRD product has a pixel spacing of 10 x 10 meters. Before December 2021, Sentinel-1B was also in orbit and is part of the archive data for CB. Detailed information is available here. |
| Reflectances Red and NIR bands (10m) | Sentinel-2 Level-1C reflectances (downloaded with the SentinelHub Asynchronous API) for the two bands: red (around 665 nm) and NIR (near-infrared around 842 nm). This product provides orthorectified (geometric ortho-correction taking into account a DEM) Top Of Atmosphere reflectance (more details here). The cloud masking is performed in-house using S2Cloudless. Detailed information is available here. |
| Reflectances Red and NIR bands (3.7m) | PlanetScope Ortho Scene product provides orthorectified, multispectral imagery from the PlanetScope constellation, for the red (around 665 nm) and NIR (near-infrared around 865 nm) bands. The imagery is collected by the SuperDove satellites at a 3.7-meter ground sample distance (GSD) at nadir and has a pixel size of approximately 3.7 meters after orthorectification. The product is processed to remove geometric distortions, using ground control points (GCPs) and digital elevation models (DEMs), ensuring a positional accuracy of less than 10 meters RMSE at the 90th percentile. The UDM 2.1 cloudmask is applied to the product. Detailed information is available here. |
| Field Boundaries | Geospatial boundaries of agricultural fields, used to define the areas for biomass estimation. These boundaries are essential for accurate data fusion, as the product works at field-level. The boundaries are provided by the client in a GeoJSON format. |
Data Quality
Validation
We have rigorously evaluated the CB against both field measurements and other remote sensing products, such as NDVI. Given the wide range of potential use cases—such as crop monitoring, event detection, and yield forecasting—the validation process is an ongoing effort. To illustrate its value, we will briefly explore two common use cases: crop monitoring and yield forecasting.
NDVI is commonly used for crop monitoring as it effectively measures plant greenness. However, many widely cultivated crops change color as they approach the final stages of growth before harvest. For instance, barley (or other grains) and canola exhibit significant differences when comparing CB with NDVI. As barley ripens, it changes color from green to light brown, and canola’s yellow flowers reflect more red light, leading to a decrease in NDVI values. In contrast, the CB product accounts for the actual biomass of the crops, enabling a more accurate estimation of the harvest date. This capability to measure biomass directly distinguishes CB from NDVI, particularly in assessing crop maturity and planning harvests.
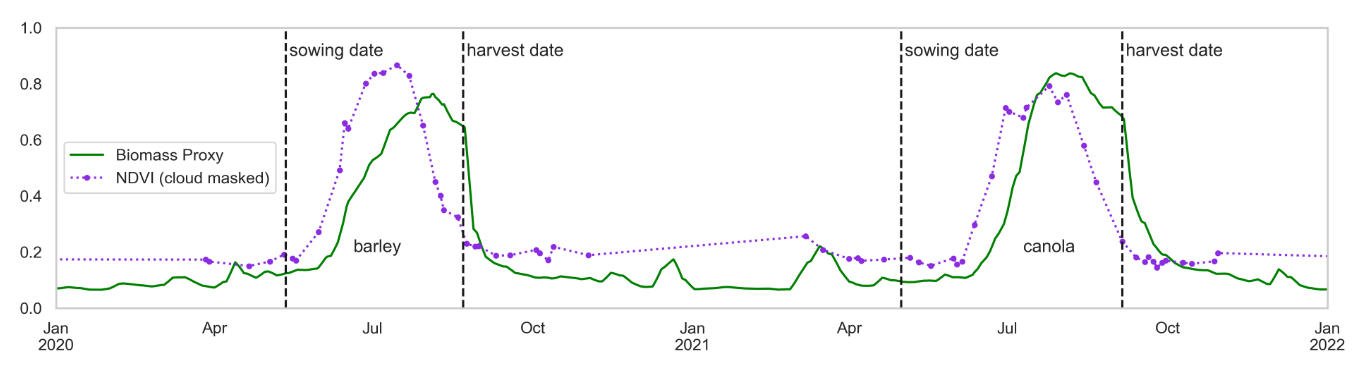 Figure 2. The Crop Biomass and NDVI time series for barley and canola, demonstrating different features associated with color changes. (Burger et al., 2024)
Paper
You can read more about the yield-related validation in the published paper Planet’s Biomass Proxy for monitoring aboveground agricultural biomass and estimating crop yield (Guillevic et al., 2024)
In the validation paper, you will find a comprehensive analysis of the product's performance in yield estimation for corn, wheat, and soybean—some of the most widely cultivated crops globally. The product's performance is assessed by correlating either the maximum or an aggregated value of biomass to the yield. Data points were collected from several fields in Mead, Nebraska, and Kellogg, Michigan. This analysis demonstrates both the Crop Biomass' ability to forecast yield before the end of the growing season, as well as to capture the intra-field variability of the biomass.
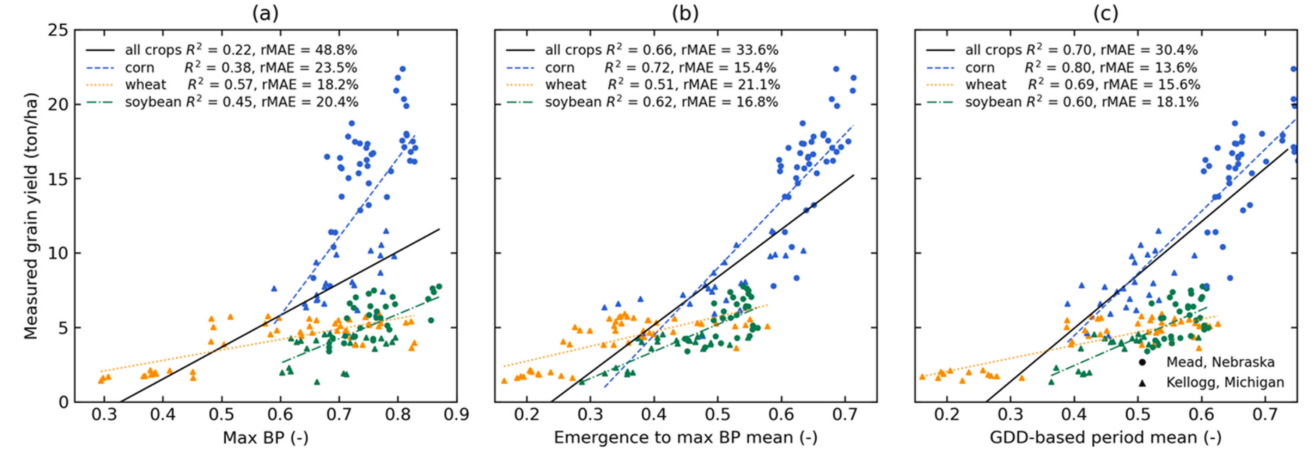 Figure 3. Relationships between crop yield and three different yield indicators based on time series of Biomass Proxy (BP): the maximum value of BP through the crop season (a), the mean values of BP from crop emergence to BP max (b) and the mean value of BP over growing-degree-days (GDD) -based integration periods.(Guillevic et al., 2024)
Quality Control
Quality control of the Crop Biomass product is conducted on two levels: within the algorithm itself and through metadata. The algorithm ensures quality in several ways, beginning with the quality of the input data. Each observation is assigned a "quality factor" based on the number of valid pixels (i.e., those without clouds, water, snow, roads, buildings, etc.) and this factor decreases over time. This mechanism, along with extensive preprocessing of all input data, ensures that the product remains as up-to-date and accurate as possible.
Additionally, the daily GeoTIFF files include metadata that provides transparency regarding how the product is constructed.
Table 4. Metadata parameters
| Metadata | Description |
|---|---|
| DATE_LAST_OPTICAL_IMAGE_USED | The date of the most recent optical image used in the product. This can support the understanding and interpretation of the signal, as it is an indication of the relative contribution of the optical data. |
| DATE_LAST_S1_IMAGE_USED | The date of the most recent Sentinel-1 SAR image used in the product. This can support the understanding and interpretation of the signal, as it is an indication of the relative contribution of the radar data. |
| LAST_OPTICAL_IMAGE_SOURCE | The source of the most recent optical image used, either "PS" (PlanetScope) or "S2" (Sentinel-2). |
| PERCENTAGE_PIXELS_MASKED | The percentage of pixels in the dataset that were masked due to issues such as cloud cover, water, snow, roads, or buildings. A value of "0.0" indicates that no pixels were masked, meaning the data is complete and unaltered. |
| PRODUCT_VERSION | The version of the product, "v4", indicates the current version of the Crop Biomass product, reflecting the most recent updates and improvements in the methodology and data processing. |
Below is a Python code snippet on how to extract the metadata from the .tif file of interest.
from osgeo import gdal

def get_metadata_from_raster(file_path: str) -> dict:
    dataset = gdal.Open(file_path)
    metadata = dataset.GetMetadata()
    return metadata
Limitations
The following are some key limitations that need to be considered: - Limited coverage of Sentinel-1: Since the outage of Sentinel-1B in December 2021, Crop Biomass can only be delivered in some areas of the world. Unfortunately, some major agricultural areas are affected such as SE Brazil, SW Australia and some countries in SW and Central Africa. - Sentinel-1 signal is not NDVI: The agricultural market is “trained” on NDVI. The cross-ratio is an index derived from different Sentinel-1 polarizations. The differences in behavior between radar-based and optical index must be considered when offering this product. - Behavior in pastures and grasslands: In our experience, C-band radar indices might not capture the dynamics of vegetation change in grazing areas.
Frequently Asked Questions
What is Crop Biomass?
It is a 10-m field-based raster that is delivered daily. Each pixel has a value from 0 (low) to 1 (high) biomass.
What sources of data are used to create the Crop Biomass?
Crop Biomass is a fusion of active microwave imagery from the European Space Agency (ESA) Sentinel-1 satellite and optical images from Sentinel-2 and PlanetScope satellites.
How far back does the archive go?
The archive goes back to January 1, 2019.
Will the Crop Biomass PV work for smallholder farms?
We tested the product in different regions with small-scale fields. While the data shows consistency up to 0.2 hectares, its quality will also depend on the presence of mixed crops.
Is there demo data available?
Demo data should be prepared by pre-sales on-demand.
Once a customer has ordered Crop Biomass, how long will it take for us to deliver it to them?
Once a subscription is created, all data (including archive) should be in the users’ cloud bucket.
Can customers use the Crop Biomass in Sentinel Hub?
Yes, subscriptions can be generated and visualized in the EO Browser. Also, subscriptions can be hosted in Sentinel Hub through Planet’s API.
Does Crop Biomass work for orchards and vineyards?
We tested our data in different crops including orchards and vineyards. As mentioned above, the behavior of Sentinel-1 derived indices is different from the ones from optical-derived sources. Our team can share information with prospective customers that are crop-specific.
Where can I produce Crop Biomass?
Unfortunately, since the outage of Sentinel-1B in December 2021, CB is no longer available globally. The updated geographic coverage of Sentinel-1 coverage is shown here. It is expected that the launch of Sentinel-1C towards the end of 2024 will re-establish the global coverage of this product. You can find the latest coverage maps here.
What are the main differences between v3 and v4?
In numerous (visible and invisible) ways, the Crop Biomass product has seen significant improvements from version 3 to version 4. These enhancements include orbit correction, an optimized fusion strategy, and, most notably, the integration of PlanetScope imagery. Together, these updates contribute to a more accurate signal, both temporally and spatially.
How can I extract the metadata?
The simplest way to inspect the metadata is with the command line:
gdalinfo your_tif_file.tif
This will show a list of specifics of the file, such as the coordinate reference system, the pixel size, the extent, and the metadata. Alternatively, you can also do this in Python as shown in the quality control section.
We are continually working to improve our technical documentation and support. Please help by sharing your experience with us.