Overview
Whether you're a data scientist, a software developer, or perhaps just a curious hobbyist: you may find yourself wondering what's so special about spatial data? If so, you're not alone: read on for a gentle introduction to this unique type of data. When you've finished, continue at Planet School to learn more about using geospatial data to gain insights into the world around us.
What are we talking about?
Let's begin with some terminology: there are a lot of different terms you may hear people use for more or less the same type of thing. Already here we've used both geospatial and spatial interchangably. Before we go on, let's establish some common ground.
You might have heard the acronym GIS: GIS stands for Geographic Information Systems, and can refer to computer systems, infrastructure, software, data, or any mix of these things together. A GIS user uses GIS tools created by a GIS developer to interact with GIS data. Over time, as the importance of location information has increased in areas outside the traditional GIS industry, the term "GIS" has evolved to refer to anything related to geospatial data.
As for that: Geospatial, or just Spatial, data is simply data with location information included: geospatial datasets connect a what to a where.
Within Planet School, we most commonly use geospatial (or spatial), in order to emphasize the industry-agnostic application of this type of data.
Spatial isn't so special
Let's take a look at "regular" data, versus "spatial" data, using a public dataset from data.austintexas.gov.
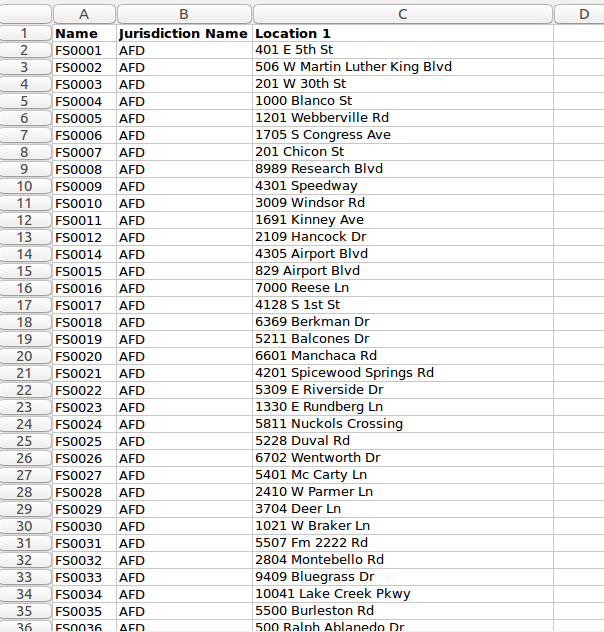
Below is a table of data. Each row represents a single record, and
each column has a name describing its content. If you've ever edited data in a
spreadsheet, this probably seems familiar:
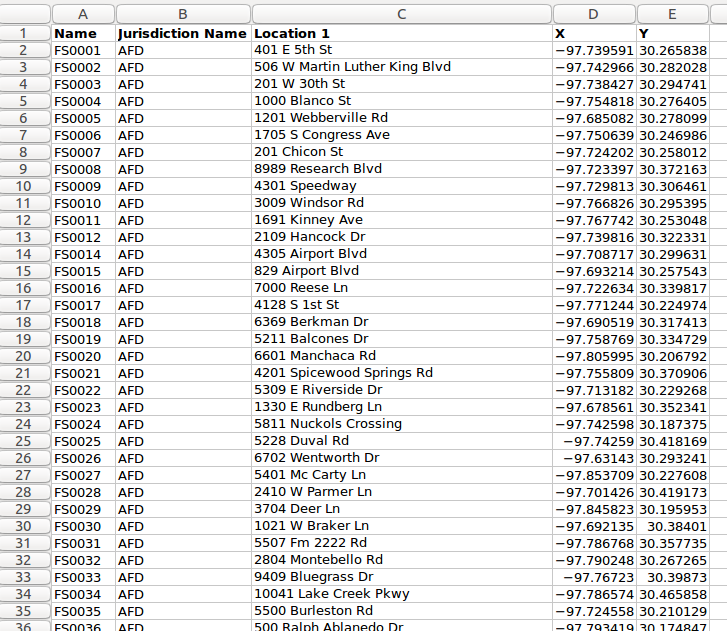
To turn that table of data into geospatial data, all we need to do is add
location information to each record. Here, we've added longitude and
latitude (or lon/lat) coordinates to the data. Pairs of lon/lat values are
used to represent a point on the Earth's surface (later in this tutorial we'll
learn more about coordinates):
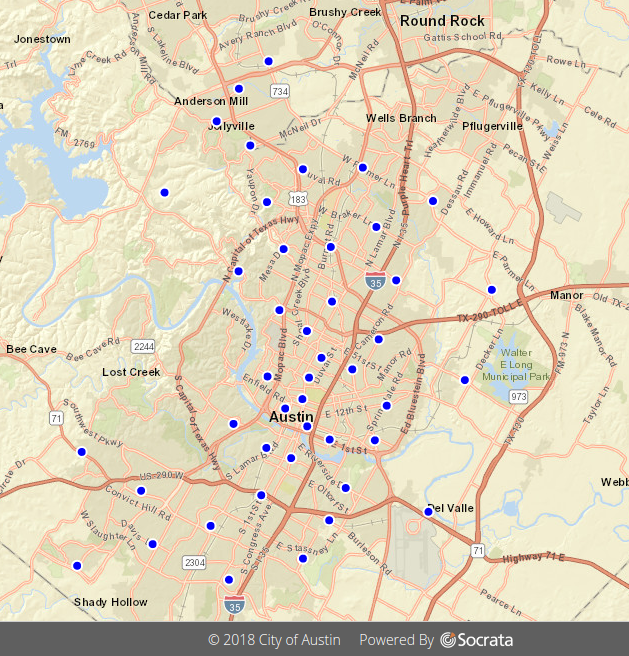
Using that location information, we can then create a map of our original data. Each
point on this map represents one record from the data table:
Vector vs. Raster
Geospatial data comes in two flavors: vector, and raster. When working with geospatial data, knowing the type of data you are interacting with can help you choose the right tools for the job: for example, one command-line interface for extracting metadata information about your dataset may be better suited for vector data, while another similar tool works better for raster data.
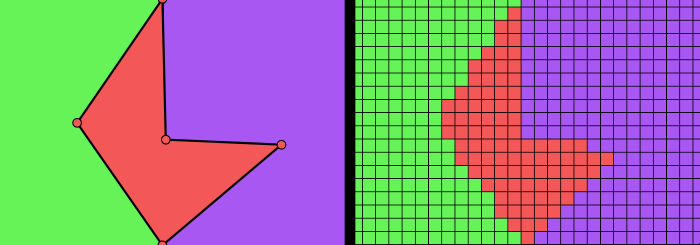
Vector data is composed of points, lines, and polygons:
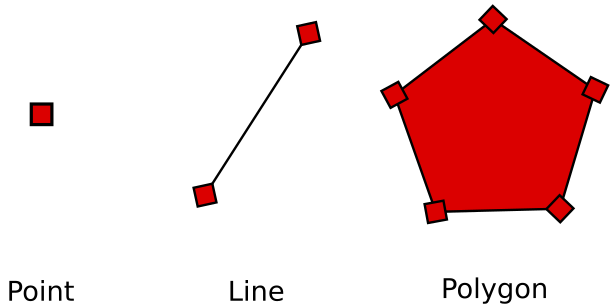
In a vector dataset, each point represents a value at a specific X,Y
point in space. Vector data is best suited for representing discrete features:
e.g., the firestations represented by points in the example above. Other
examples might be roads represented by lines, or lakes by polygons.
In contrast, raster data is composed of pixels: small, uniformly-sized, grid cells:
In a raster dataset, each pixel has a value. Pixels representing equivalent data have the same value:
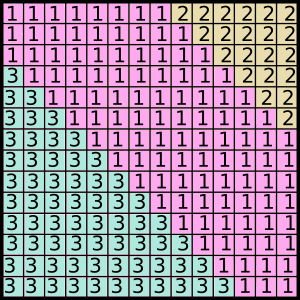
Rasters are well-suited for representing continuous data across a broad area: for example, elevation data or temperature measurements.
Raster pixels may also be used to represent color values: satellite imagery is an example of this kind of data. In the following image, zooming in on an area allows you to see how each tiny square has a unique value; when put together these pixels make up an image.
Common geospatial file types
As you start to explore the wide world of geospatial data, it can be useful to become familiar with a few of the most common file types you might run across. There are dozens, if not hundreds, of formats of geospatial data, but some of the more popular formats include:
- GeoJSON
- A standardized format for representing vector data features. Based on JSON, GeoJSON can be edited in any text editor, and is especially well-suited to geospatial data transmitted over the web
- Shapefile
- A very popular vector data file format: despite the name, a "shapefile" is
actually a collection of files with a common filename prefix (i.e.,
mydata.shp+mydata.shx+mydata.dbf) - GeoTIFF
- An ordinary TIFF image file, with location information included: spatial
reference information is either
embedded within the TIFF file itself, or (in some versions) included as a
*.tfwsidecar file alongside the TIFF. Used to store raster data.
In the guides and tutorials you'll find here on Planet's Developer Center, the most common files types you'll run across are GeoJSON and GeoTIFF. Some of the tools you can learn about here can be used to easily convert data between common geospatial file formats.
Defining location
Earlier we learned that geospatial data is data with location information attached. But how, exactly, do we define "location"?
Coordinates
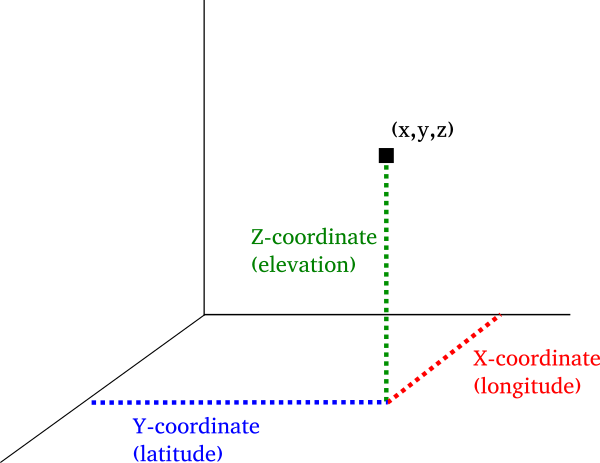
In a 3D world, specific points in space can be referred to using their coordinates along each of three directional axes:
Coordinate Systems
The geometric concept above also applies to geographic space: any point on the
Earth can be described by its latitude, longitude, and (optionally) its
elevation. The systems that are used to describe points on the Earth's
surface are called geographic coordinate systems (GCS). A GCS uses a
mathematically-defined surface called an ellipsoid to represent the Earth's
shape. Complex computations based on that ellipsoid define the coordinates that
can be used to reference a unique point. There are many coordinate systems,
some more common than others: WGS 84 is the one you will see used most often.
Map Projections
Map Projections allow us to translate locations from a 3D surface (like a globe) onto a flat surface (like a map). Imagine peeling an orange, and then attempting to flatten the peel on a table: it will never perfectly lie flat, and you'll find yourself trying to stretch, cut, or squash the peel in the attempt. Similarly, because the Earth is not flat, map projections must always distort the features they map in some way. Different projections might be chosen depending on the way they distort an area's features.
Geospatial data that has been transformed in order to fit a flat surface is called projected data. The projection used for this transformation is part of the geospatial information (metadata) unique to your data file. Similarly, data that has not been transformed from a global model is called unprojected: in this case, the geographic coordinate system will be included in the metadata for that data file.
Next Steps
Now that you've learned a bit about what makes geospatial data special, you should find yourself better equipped to begin working with this kind of data. Head back to Planet School for more foundational concepts -- or dive in to the Quickstart if you're ready to get started with Planet's API.
Appendix: terms to know
- Geospatial data
- Data that has location information associated with each object described
- Vector
- Geospatial data composed of points, lines, or polygons: each point represents a value
- Raster
- Geospatial data composed of pixels (or grid cells): each pixel represents a value
- Coordinate
- A pair of
(X,Y)values used to reference a point in space: in a GCS these arelong, lat(longitude, latitude) numbers - Coordinate System
- A way of representing data about the Earth's surface on a 3-dimensional (global) surface, using degrees of latitude and longitude to describe points. Also known as a Geographic Coordinate System (GCS)
- Map Projection
- A way of translating 3-dimensional data into 2-dimensional space: projections are how we flatten global data onto a map's surface. Also known as a Projected Coordinate System
Rate this guide: